
- Start >
- Rivers >
- Discharge >
- Regnitz >
- Weinzierlein >
- Chart of year

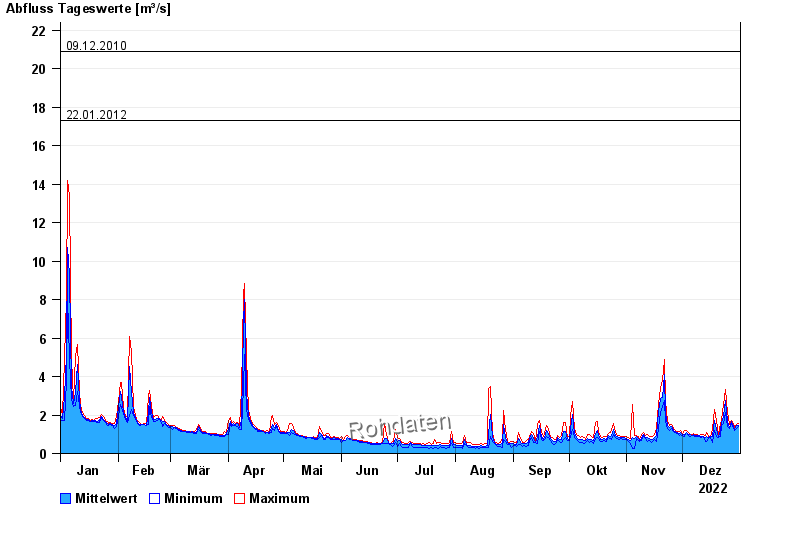
Chart of year Weinzierlein / Bibert
Discharge from 01.01.2022 to 31.12.2022
- 08.01.2011 Abfluss: 41,5 m³/s
- 14.01.2011 Abfluss: 24,7 m³/s
- 01.06.2013 Abfluss: 22,9 m³/s
- 09.12.2010 Abfluss: 20,9 m³/s
- 22.01.2012 Abfluss: 17,3 m³/s
| Date | Mean value [m³/s] | Maximum [m³/s] | Minimum [m³/s] |
|---|---|---|---|
| 31.12.2022 | 1.48 | 1.58 | 1.42 |
| 30.12.2022 | 1.43 | 1.5 | 1.31 |
| 29.12.2022 | 1.26 | 1.35 | 1.21 |
| 28.12.2022 | 1.4 | 1.58 | 1.28 |
| 27.12.2022 | 1.67 | 1.72 | 1.54 |
| 26.12.2022 | 1.33 | 1.5 | 1.28 |
| 25.12.2022 | 1.66 | 2.15 | 1.39 |
© Bayerisches Landesamt für Umwelt 2024