
- Start >
- Rivers >
- Discharge >
- Regnitz >
- Weinzierlein >
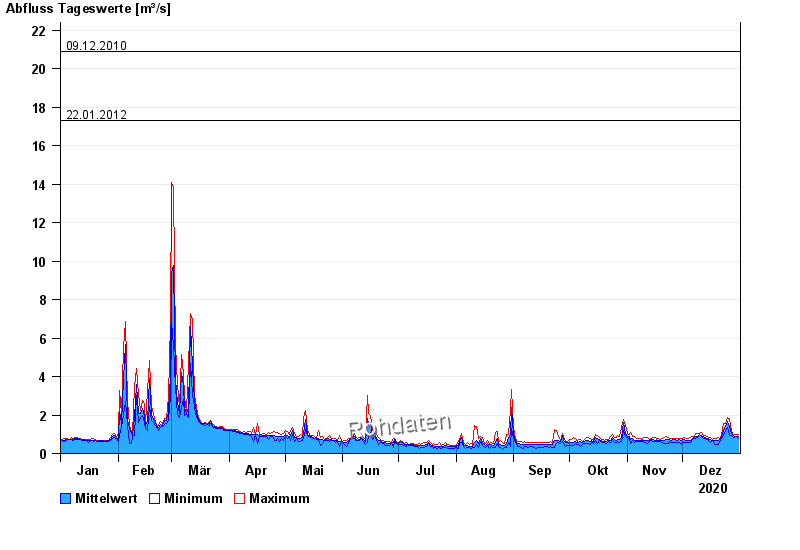
- Chart of year

Chart of year Weinzierlein / Bibert
Discharge from 01.01.2020 to 31.12.2020
- 08.01.2011 Abfluss: 41,5 m³/s
- 14.01.2011 Abfluss: 24,7 m³/s
- 01.06.2013 Abfluss: 22,9 m³/s
- 09.12.2010 Abfluss: 20,9 m³/s
- 22.01.2012 Abfluss: 17,3 m³/s
| Date | Mean value [m³/s] | Maximum [m³/s] | Minimum [m³/s] |
|---|---|---|---|
| 31.12.2020 | 0.859 | 0.963 | 0.801 |
| 30.12.2020 | 0.907 | 0.962 | 0.879 |
| 29.12.2020 | 0.903 | 0.962 | 0.838 |
| 28.12.2020 | 0.912 | 0.96 | 0.838 |
| 27.12.2020 | 1.03 | 1.13 | 0.918 |
| 26.12.2020 | 1.42 | 1.8 | 0.959 |
| 25.12.2020 | 1.65 | 1.89 | 1.35 |
© Bayerisches Landesamt für Umwelt 2024