
- Start >
- Rivers >
- Discharge >
- Regnitz >
- Unterleinleiter >
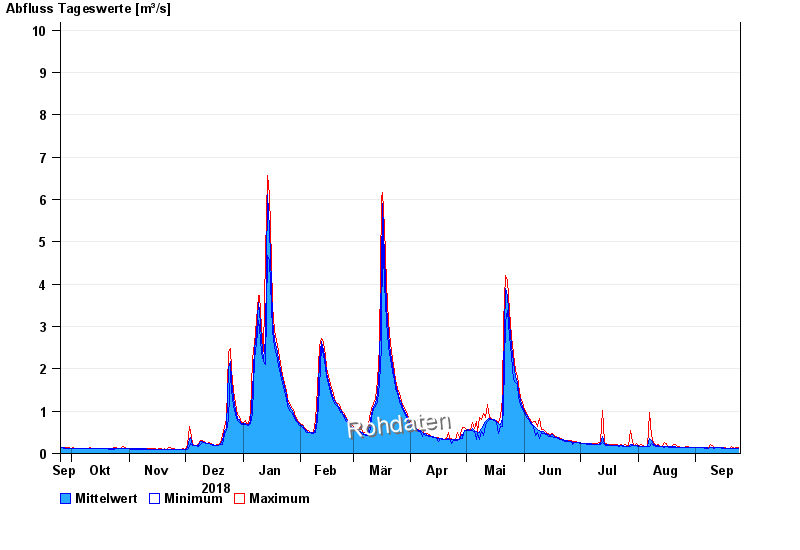
- Chart of year

Chart of year Unterleinleiter / Leinleiterbach
Discharge from 25.09.2018 to 24.09.2019
- 23.02.1970 Abfluss: 31 m³/s
- 26.01.1995 Abfluss: 30,7 m³/s
- 06.01.1982 Abfluss: 23,5 m³/s
- 26.03.1988 Abfluss: 21 m³/s
- 14.01.2011 Abfluss: 19,1 m³/s
| Date | Mean value [m³/s] | Maximum [m³/s] | Minimum [m³/s] |
|---|---|---|---|
| 24.09.2019 | 0.122 | 0.13 | 0.121 |
| 23.09.2019 | 0.12 | 0.139 | 0.113 |
| 22.09.2019 | 0.117 | 0.121 | 0.113 |
| 21.09.2019 | 0.121 | 0.13 | 0.113 |
| 20.09.2019 | 0.126 | 0.162 | 0.122 |
| 19.09.2019 | 0.12 | 0.122 | 0.114 |
| 18.09.2019 | 0.121 | 0.123 | 0.114 |
© Bayerisches Landesamt für Umwelt 2024