
- Start >
- Rivers >
- Discharge >
- Regnitz >
- Unterleinleiter >
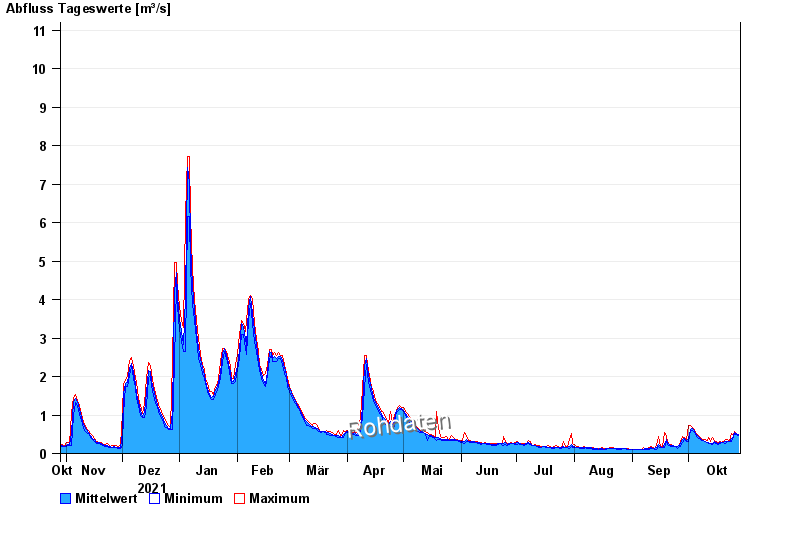
- Chart of year

Chart of year Unterleinleiter / Leinleiterbach
Discharge from 29.10.2021 to 28.10.2022
- 23.02.1970 Abfluss: 31 m³/s
- 26.01.1995 Abfluss: 30,7 m³/s
- 06.01.1982 Abfluss: 23,5 m³/s
- 26.03.1988 Abfluss: 21 m³/s
- 14.01.2011 Abfluss: 19,1 m³/s
| Date | Mean value [m³/s] | Maximum [m³/s] | Minimum [m³/s] |
|---|---|---|---|
| 28.10.2022 | 0.486 | 0.494 | 0.46 |
| 27.10.2022 | 0.517 | 0.529 | 0.494 |
| 26.10.2022 | 0.542 | 0.566 | 0.529 |
| 25.10.2022 | 0.452 | 0.482 | 0.415 |
| 24.10.2022 | 0.38 | 0.517 | 0.305 |
| 23.10.2022 | 0.308 | 0.33 | 0.305 |
| 22.10.2022 | 0.318 | 0.357 | 0.305 |
© Bayerisches Landesamt für Umwelt 2024