
- Start >
- Rivers >
- Discharge >
- Regnitz >
- Unterleinleiter >
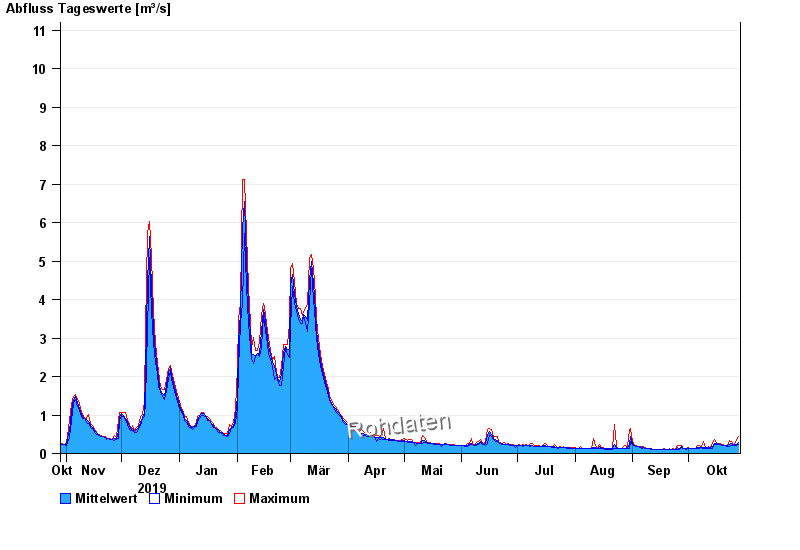
- Chart of year

Chart of year Unterleinleiter / Leinleiterbach
Discharge from 29.10.2019 to 28.10.2020
- 23.02.1970 Abfluss: 31 m³/s
- 26.01.1995 Abfluss: 30,7 m³/s
- 06.01.1982 Abfluss: 23,5 m³/s
- 26.03.1988 Abfluss: 21 m³/s
- 14.01.2011 Abfluss: 19,1 m³/s
| Date | Mean value [m³/s] | Maximum [m³/s] | Minimum [m³/s] |
|---|---|---|---|
| 28.10.2020 | 0.276 | 0.442 | 0.236 |
| 27.10.2020 | 0.246 | 0.35 | 0.218 |
| 26.10.2020 | 0.221 | 0.255 | 0.201 |
| 25.10.2020 | 0.217 | 0.234 | 0.216 |
| 24.10.2020 | 0.249 | 0.32 | 0.216 |
| 23.10.2020 | 0.231 | 0.347 | 0.184 |
| 22.10.2020 | 0.197 | 0.199 | 0.184 |
© Bayerisches Landesamt für Umwelt 2024