
- Start >
- Rivers >
- Discharge >
- Regnitz >
- Unterleinleiter >
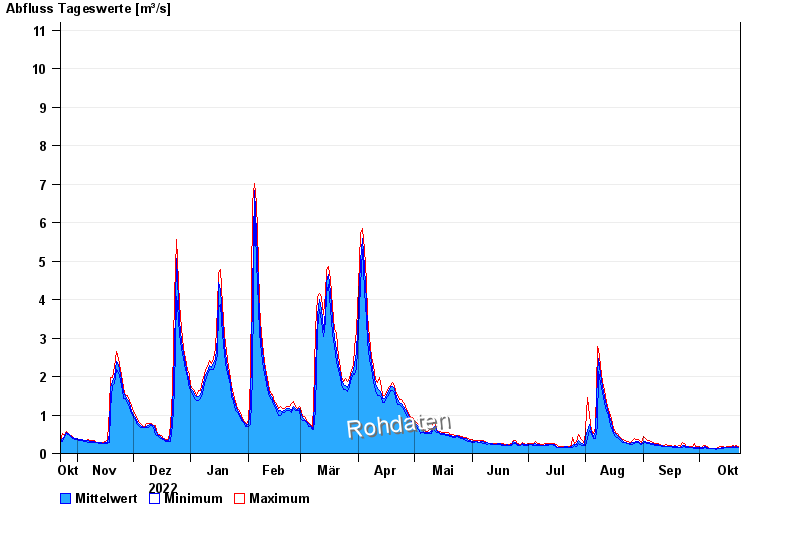
- Chart of year

Chart of year Unterleinleiter / Leinleiterbach
Discharge from 23.10.2022 to 22.10.2023
- 23.02.1970 Abfluss: 31 m³/s
- 26.01.1995 Abfluss: 30,7 m³/s
- 06.01.1982 Abfluss: 23,5 m³/s
- 26.03.1988 Abfluss: 21 m³/s
- 14.01.2011 Abfluss: 19,1 m³/s
| Date | Mean value [m³/s] | Maximum [m³/s] | Minimum [m³/s] |
|---|---|---|---|
| 22.10.2023 | 0.159 | 0.171 | 0.147 |
| 21.10.2023 | 0.176 | 0.2 | 0.159 |
| 20.10.2023 | 0.168 | 0.185 | 0.159 |
| 19.10.2023 | 0.185 | 0.217 | 0.147 |
| 18.10.2023 | 0.16 | 0.171 | 0.147 |
| 17.10.2023 | 0.165 | 0.171 | 0.147 |
| 16.10.2023 | 0.165 | 0.171 | 0.159 |
© Bayerisches Landesamt für Umwelt 2024