
- Start >
- Rivers >
- Discharge >
- Regnitz >
- Trunstadt Q >
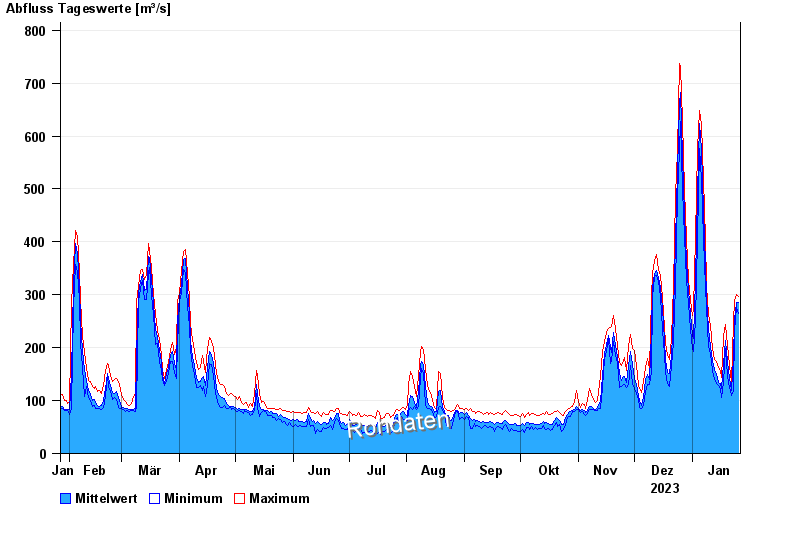
- Chart of year

Chart of year Trunstadt Q / Main
Discharge from 27.01.2023 to 26.01.2024
note
STÖRUNG BEHOBEN - Ultraschallanlage; kein Hochwasserpegel
| Date | Mean value [m³/s] | Maximum [m³/s] | Minimum [m³/s] |
|---|---|---|---|
| 26.01.2024 | 285 | 297 | 264 |
| 25.01.2024 | 286 | 300 | 275 |
| 24.01.2024 | 254 | 290 | 231 |
| 23.01.2024 | 179 | 249 | 117 |
| 22.01.2024 | 120 | 135 | 110 |
| 21.01.2024 | 141 | 167 | 125 |
| 20.01.2024 | 174 | 205 | 146 |
© Bayerisches Landesamt für Umwelt 2024