
- Start >
- Rivers >
- Discharge >
- Regnitz >
- Trunstadt Q >
- Chart of month

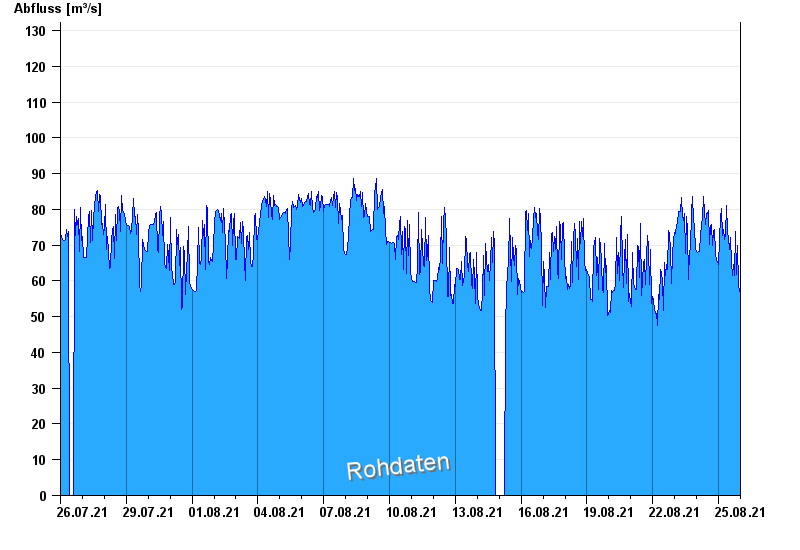
Chart of month Trunstadt Q / Main
Discharge from 26.07.2021 to 25.08.2021
note
STÖRUNG BEHOBEN - Ultraschallanlage; kein Hochwasserpegel
- Abfluss: m³/s
- Abfluss: m³/s
- Abfluss: m³/s
- Abfluss: m³/s
- Abfluss: m³/s
| Date | Runoff [m³/s] |
|---|---|
| 26.08.2021 00:45 | 56.2 |
| 26.08.2021 00:30 | 56.2 |
| 26.08.2021 00:15 | 56 |
| 26.08.2021 00:00 | 56.4 |
| 25.08.2021 23:45 | 56.6 |
| 25.08.2021 23:30 | 56.2 |
| 25.08.2021 23:15 | 56.7 |
© Bayerisches Landesamt für Umwelt 2024