

Chart of year Thann / Altmühl
Discharge from 30.09.2020 to 29.09.2021
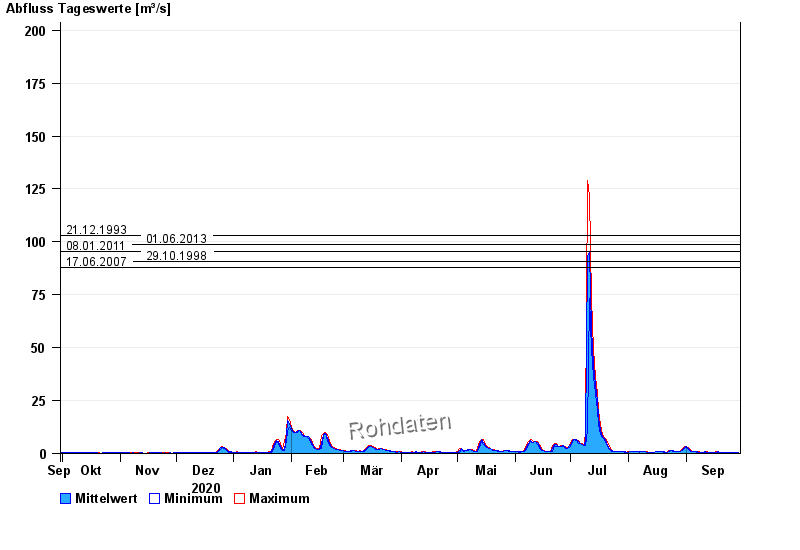
- 21.12.1993 Abfluss: 103 m³/s
- 01.06.2013 Abfluss: 98,9 m³/s
- 08.01.2011 Abfluss: 95,4 m³/s
- 29.10.1998 Abfluss: 90,8 m³/s
- 17.06.2007 Abfluss: 87,9 m³/s
| Date | Mean value [m³/s] | Maximum [m³/s] | Minimum [m³/s] |
|---|---|---|---|
| 29.09.2021 | 0.556 | 0.578 | 0.553 |
| 28.09.2021 | 0.565 | 0.578 | 0.528 |
| 27.09.2021 | 0.498 | 0.528 | 0.492 |
| 26.09.2021 | 0.505 | 0.528 | 0.492 |
| 25.09.2021 | 0.592 | 0.63 | 0.528 |
| 24.09.2021 | 0.587 | 0.63 | 0.541 |
| 23.09.2021 | 0.557 | 0.565 | 0.541 |
© Bayerisches Landesamt für Umwelt 2024