

Chart of year Thann / Altmühl
Discharge from 01.01.2023 to 31.12.2023
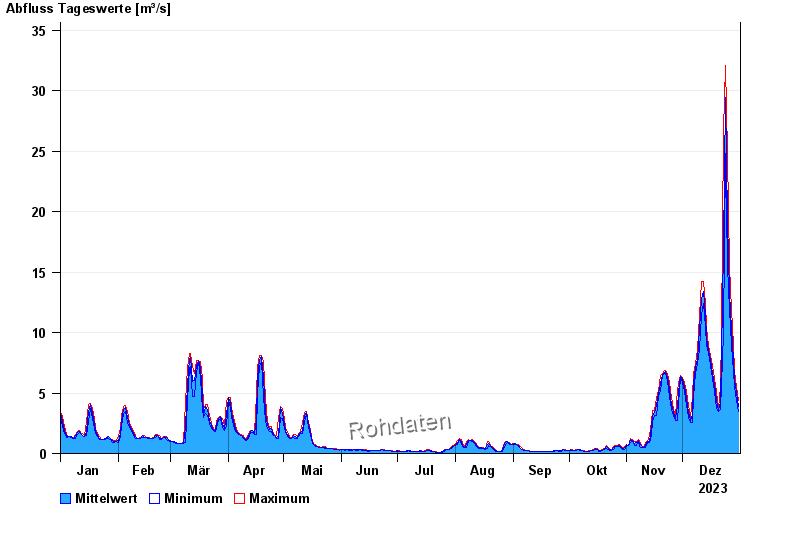
| Date | Mean value [m³/s] | Maximum [m³/s] | Minimum [m³/s] |
|---|---|---|---|
| 31.12.2023 | 3.88 | 4.41 | 3.49 |
| 30.12.2023 | 5.03 | 5.58 | 4.41 |
| 29.12.2023 | 6.1 | 6.74 | 5.58 |
| 28.12.2023 | 7.77 | 8.9 | 6.74 |
| 27.12.2023 | 10.3 | 11.9 | 8.9 |
| 26.12.2023 | 13.2 | 15.5 | 11.9 |
| 25.12.2023 | 19.2 | 24.8 | 15.5 |
© Bayerisches Landesamt für Umwelt 2024