

Chart of year Staudach / Tiroler Achen
Discharge from 25.09.2023 to 24.09.2024
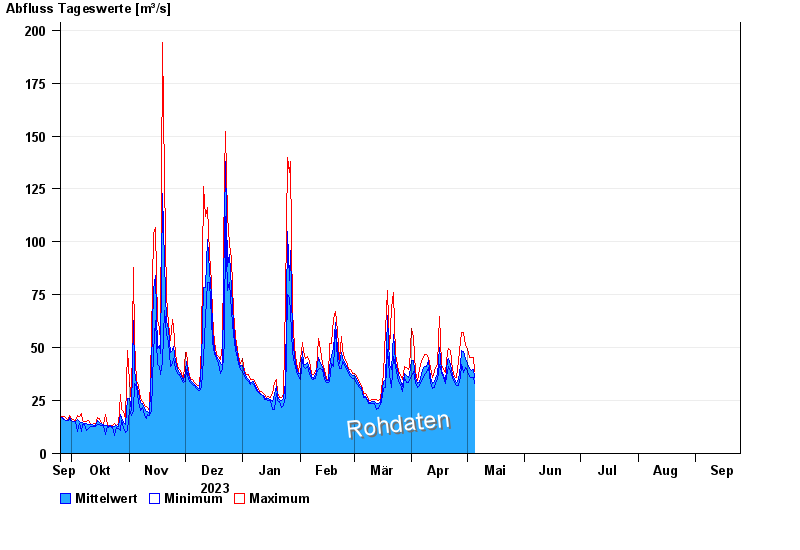
| Date | Mean value [m³/s] | Maximum [m³/s] | Minimum [m³/s] |
|---|---|---|---|
| 19.06.2024 | 38.2 | 40 | 37.7 |
| 18.06.2024 | 41.6 | 43.2 | 39.3 |
| 17.06.2024 | 44.2 | 47.3 | 41.6 |
| 16.06.2024 | 55.7 | 70.8 | 47.3 |
| 15.06.2024 | 45.1 | 46.5 | 43.2 |
| 14.06.2024 | 50.3 | 53.3 | 46.5 |
| 13.06.2024 | 58.6 | 64.2 | 53.3 |
© Bayerisches Landesamt für Umwelt 2024