

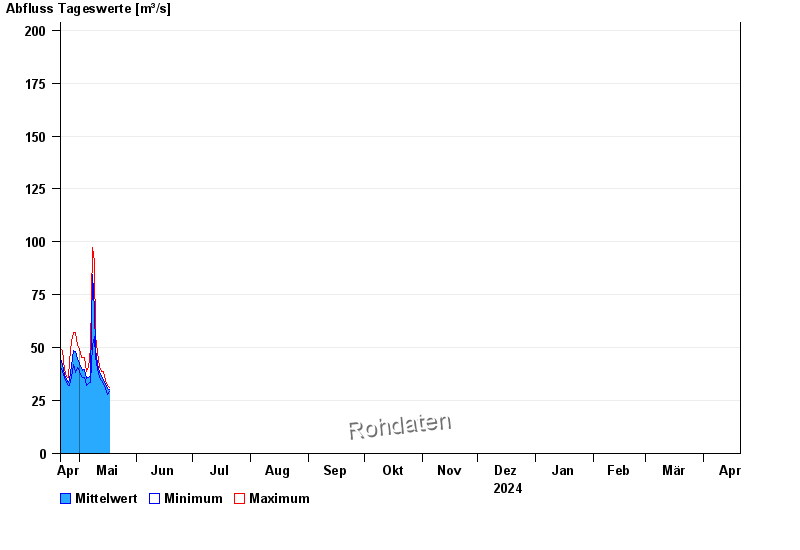
Chart of year Staudach / Tiroler Achen
Discharge from 21.04.2024 to 20.04.2025
- HQ1 272 m³/s
- HQ2 350 m³/s
- HQ5 440 m³/s
- HQ10 530 m³/s
- HQ20 630 m³/s
- HQ50 760 m³/s
- HQ100 870 m³/s
| Date | Mean value [m³/s] | Maximum [m³/s] | Minimum [m³/s] |
|---|---|---|---|
| 03.05.2024 | 37.9 | 39.7 | 35.9 |
| 02.05.2024 | 40.3 | 45.3 | 36.6 |
| 01.05.2024 | 42.7 | 49.4 | 38.9 |
| 30.04.2024 | 45 | 51.2 | 40.5 |
| 29.04.2024 | 48.2 | 57.3 | 38.1 |
| 28.04.2024 | 48.7 | 57.3 | 42.1 |
| 27.04.2024 | 41.5 | 53 | 35.9 |
© Bayerisches Landesamt für Umwelt 2024