

Chart of year Schwabach / Schwabach
Discharge from 18.04.2024 to 17.04.2025
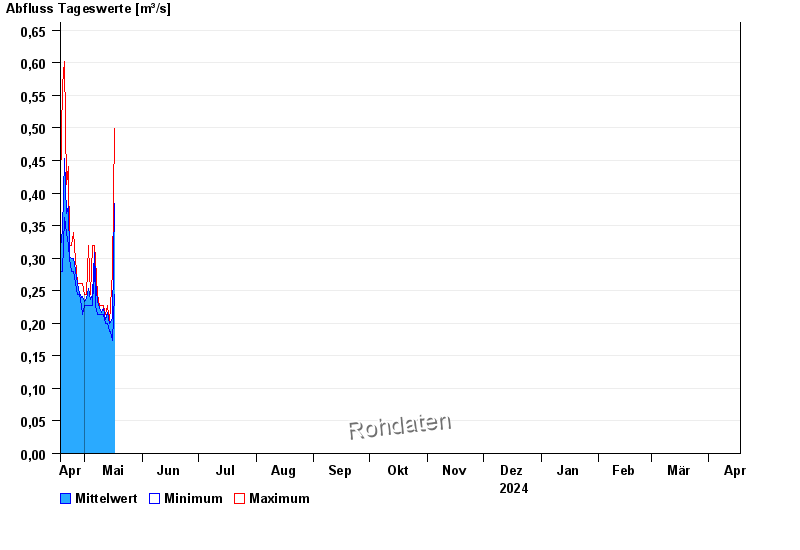
| Date | Mean value [m³/s] | Maximum [m³/s] | Minimum [m³/s] |
|---|---|---|---|
| 30.04.2024 | 0.23 | 0.244 | 0.228 |
| 29.04.2024 | 0.239 | 0.261 | 0.228 |
| 28.04.2024 | 0.245 | 0.261 | 0.244 |
| 27.04.2024 | 0.261 | 0.261 | 0.244 |
| 26.04.2024 | 0.281 | 0.298 | 0.261 |
| 25.04.2024 | 0.299 | 0.34 | 0.279 |
| 24.04.2024 | 0.3 | 0.319 | 0.279 |
© Bayerisches Landesamt für Umwelt 2024