

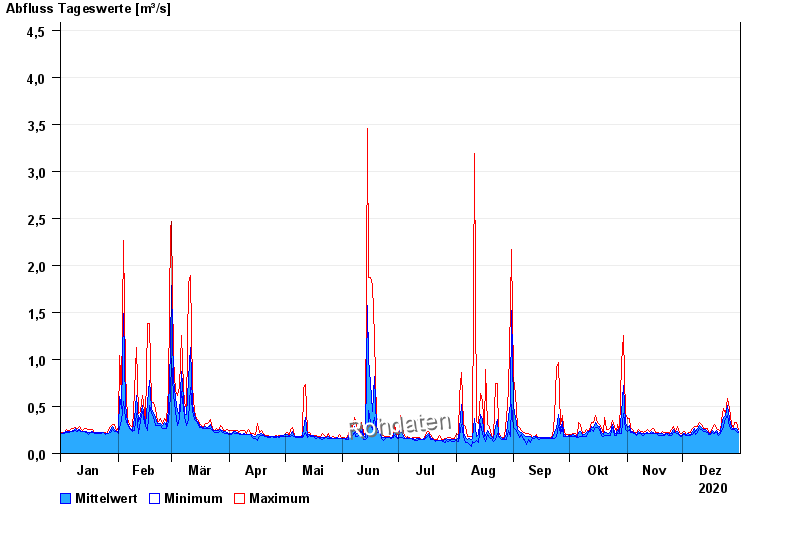
Chart of year Schwabach / Schwabach
Discharge from 01.01.2020 to 31.12.2020
- 08.01.2011 Abfluss: 8,17 m³/s
- 09.03.2006 Abfluss: 8,11 m³/s
- 02.03.1987 Abfluss: 7,37 m³/s
- 29.10.1998 Abfluss: 7,36 m³/s
- 16.03.2005 Abfluss: 7,26 m³/s
| Date | Mean value [m³/s] | Maximum [m³/s] | Minimum [m³/s] |
|---|---|---|---|
| 31.12.2020 | 0.239 | 0.253 | 0.222 |
| 30.12.2020 | 0.271 | 0.33 | 0.237 |
| 29.12.2020 | 0.266 | 0.33 | 0.253 |
| 28.12.2020 | 0.262 | 0.27 | 0.253 |
| 27.12.2020 | 0.275 | 0.309 | 0.253 |
| 26.12.2020 | 0.367 | 0.483 | 0.289 |
| 25.12.2020 | 0.509 | 0.58 | 0.4 |
© Bayerisches Landesamt für Umwelt 2024