

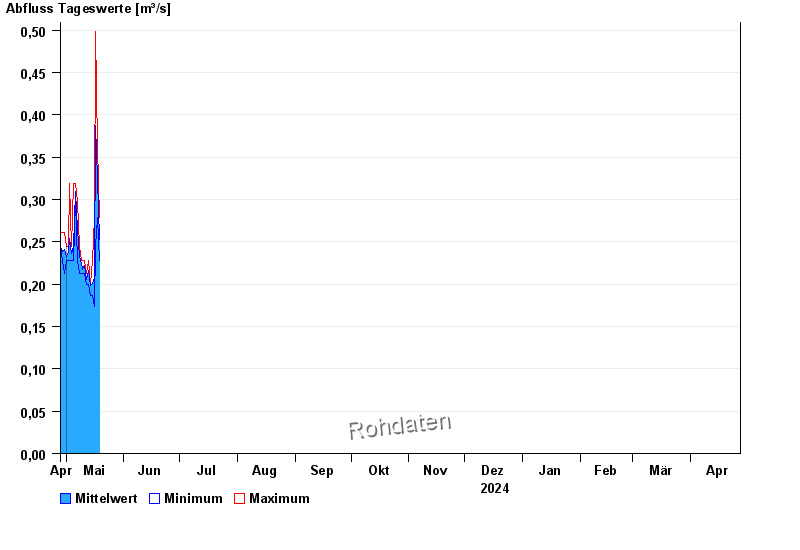
Chart of year Schwabach / Schwabach
Discharge from 28.04.2024 to 27.04.2025
 Für diesen Pegel sind keine Jährlichkeiten hinterlegt.
| Date | Mean value [m³/s] | Maximum [m³/s] | Minimum [m³/s] |
|---|---|---|---|
| 08.05.2024 | 0.235 | 0.244 | 0.213 |
| 07.05.2024 | 0.265 | 0.298 | 0.228 |
| 06.05.2024 | 0.309 | 0.319 | 0.298 |
| 05.05.2024 | 0.244 | 0.319 | 0.228 |
| 04.05.2024 | 0.236 | 0.244 | 0.228 |
| 03.05.2024 | 0.254 | 0.319 | 0.228 |
| 02.05.2024 | 0.238 | 0.244 | 0.228 |
© Bayerisches Landesamt für Umwelt 2024