
- Start >
- Rivers >
- Discharge >
- Regnitz >
- Schnaittach Markt >
- Chart of year

Chart of year Schnaittach Markt / Schnaittach
Discharge from 30.03.2020 to 29.03.2021
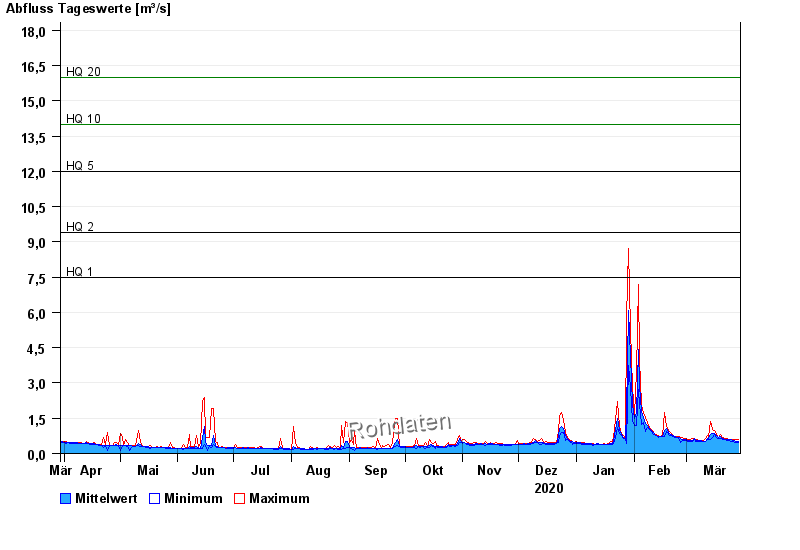
- HQ1 7,5 m³/s
- HQ2 9,4 m³/s
- HQ5 12 m³/s
- HQ10 14 m³/s
- HQ20 16 m³/s
- HQ50 20 m³/s
- HQ100 22 m³/s
| Date | Mean value [m³/s] | Maximum [m³/s] | Minimum [m³/s] |
|---|---|---|---|
| 29.03.2021 | 0.525 | 0.575 | 0.48 |
| 28.03.2021 | 0.528 | 0.576 | 0.481 |
| 27.03.2021 | 0.532 | 0.578 | 0.482 |
| 26.03.2021 | 0.537 | 0.579 | 0.529 |
| 25.03.2021 | 0.578 | 0.581 | 0.531 |
| 24.03.2021 | 0.58 | 0.582 | 0.532 |
| 23.03.2021 | 0.582 | 0.633 | 0.533 |
© Bayerisches Landesamt für Umwelt 2024