
- Start >
- Rivers >
- Discharge >
- Regnitz >
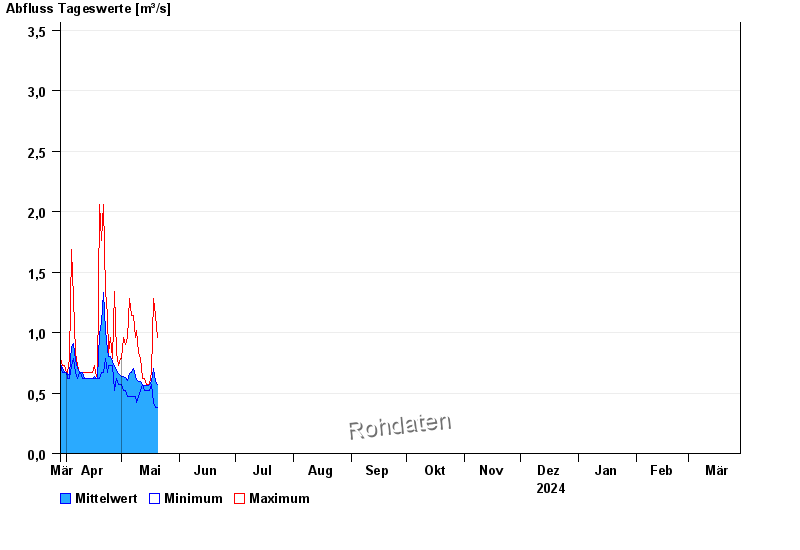
- Schnaittach Markt >
- Chart of year

Chart of year Schnaittach Markt / Schnaittach
Discharge from 29.03.2024 to 28.03.2025
- 26.01.1995 Abfluss: 18 m³/s
- 27.10.1998 Abfluss: 14,8 m³/s
- 23.12.2012 Abfluss: 14,2 m³/s
- 26.02.1997 Abfluss: 13,1 m³/s
- 02.07.1987 Abfluss: 12,9 m³/s
| Date | Mean value [m³/s] | Maximum [m³/s] | Minimum [m³/s] |
|---|---|---|---|
| 10.05.2024 | 0.61 | 0.671 | 0.519 |
| 09.05.2024 | 0.608 | 1.02 | 0.425 |
| 08.05.2024 | 0.635 | 0.96 | 0.471 |
| 07.05.2024 | 0.701 | 1.14 | 0.471 |
| 06.05.2024 | 0.672 | 1.14 | 0.471 |
| 05.05.2024 | 0.665 | 1.28 | 0.471 |
| 04.05.2024 | 0.606 | 0.96 | 0.471 |
© Bayerisches Landesamt für Umwelt 2024