
- Start >
- Rivers >
- Discharge >
- Regnitz >
- Schnaittach Markt >
- Chart of year

Chart of year Schnaittach Markt / Schnaittach
Discharge from 01.01.2023 to 31.12.2023
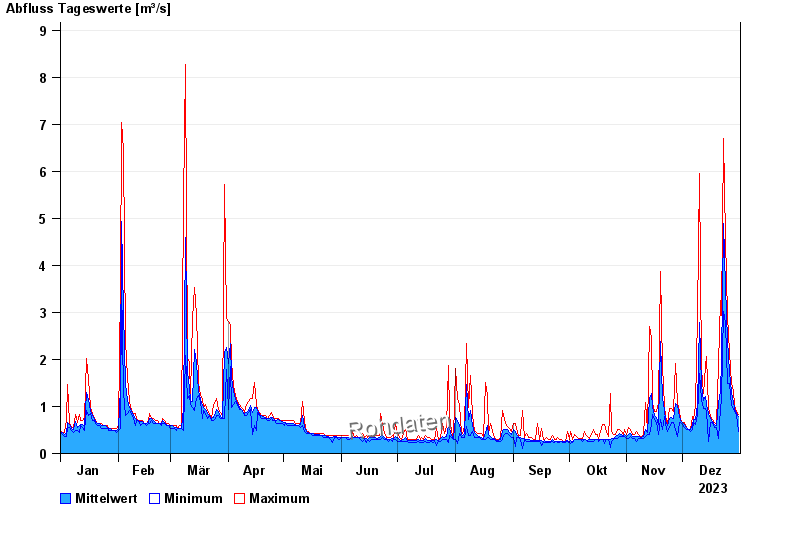
| Date | Mean value [m³/s] | Maximum [m³/s] | Minimum [m³/s] |
|---|---|---|---|
| 31.12.2023 | 0.786 | 0.836 | 0.461 |
| 30.12.2023 | 0.861 | 0.894 | 0.836 |
| 29.12.2023 | 0.963 | 1.02 | 0.894 |
| 28.12.2023 | 1.09 | 1.34 | 0.955 |
| 27.12.2023 | 1.3 | 1.48 | 1.02 |
| 26.12.2023 | 1.74 | 2.14 | 1.48 |
| 25.12.2023 | 2.4 | 2.93 | 1.48 |
© Bayerisches Landesamt für Umwelt 2024