
- Start >
- Rivers >
- Discharge >
- Regnitz >
- Schnaittach Markt >
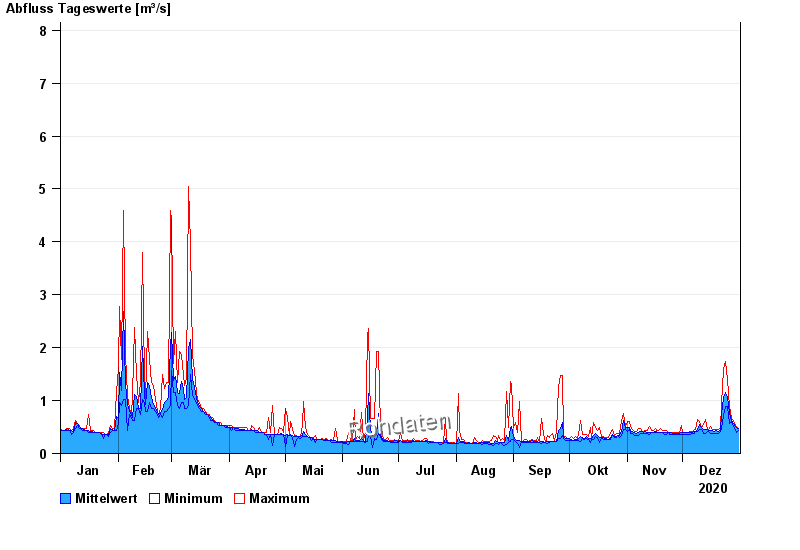
- Chart of year

Chart of year Schnaittach Markt / Schnaittach
Discharge from 01.01.2020 to 31.12.2020
- 26.01.1995 Abfluss: 18 m³/s
- 27.10.1998 Abfluss: 14,8 m³/s
- 23.12.2012 Abfluss: 14,2 m³/s
- 26.02.1997 Abfluss: 13,1 m³/s
- 02.07.1987 Abfluss: 12,9 m³/s
| Date | Mean value [m³/s] | Maximum [m³/s] | Minimum [m³/s] |
|---|---|---|---|
| 31.12.2020 | 0.472 | 0.474 | 0.43 |
| 30.12.2020 | 0.49 | 0.518 | 0.389 |
| 29.12.2020 | 0.523 | 0.566 | 0.471 |
| 28.12.2020 | 0.569 | 0.615 | 0.516 |
| 27.12.2020 | 0.628 | 0.667 | 0.614 |
| 26.12.2020 | 0.764 | 0.887 | 0.563 |
| 25.12.2020 | 1.06 | 1.39 | 0.886 |
© Bayerisches Landesamt für Umwelt 2024