
- Start >
- Rivers >
- Discharge >
- Regnitz >
- Schnaittach Markt >
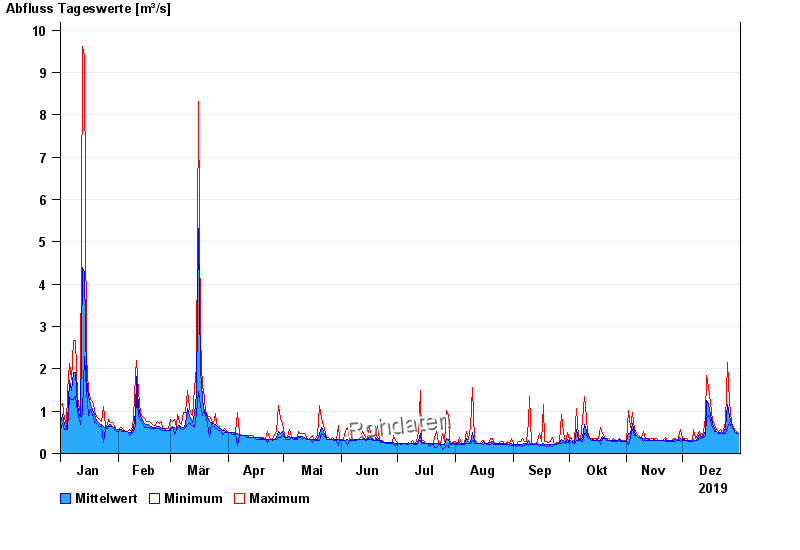
- Chart of year

Chart of year Schnaittach Markt / Schnaittach
Discharge from 01.01.2019 to 31.12.2019
| Date | Mean value [m³/s] | Maximum [m³/s] | Minimum [m³/s] |
|---|---|---|---|
| 31.12.2019 | 0.476 | 0.476 | 0.475 |
| 30.12.2019 | 0.493 | 0.524 | 0.475 |
| 29.12.2019 | 0.528 | 0.573 | 0.524 |
| 28.12.2019 | 0.586 | 0.625 | 0.573 |
| 27.12.2019 | 0.682 | 0.732 | 0.625 |
| 26.12.2019 | 0.886 | 1.21 | 0.732 |
| 25.12.2019 | 1.16 | 2.14 | 0.624 |
© Bayerisches Landesamt für Umwelt 2024