
- Start >
- Rivers >
- Discharge >
- Regnitz >
- Schnaittach Markt >
- Chart of year

Chart of year Schnaittach Markt / Schnaittach
Discharge from 01.01.2018 to 31.12.2018
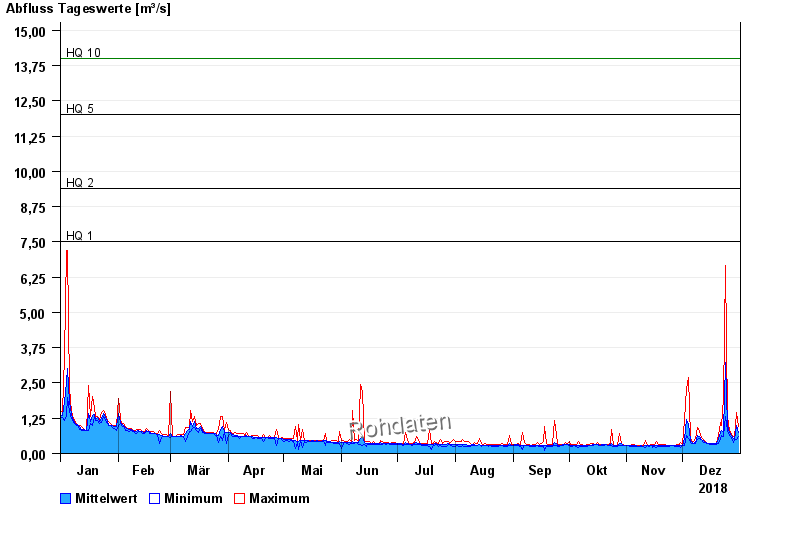
- HQ1 7,5 m³/s
- HQ2 9,4 m³/s
- HQ5 12 m³/s
- HQ10 14 m³/s
- HQ20 16 m³/s
- HQ50 20 m³/s
- HQ100 22 m³/s
| Date | Mean value [m³/s] | Maximum [m³/s] | Minimum [m³/s] |
|---|---|---|---|
| 31.12.2018 | 0.736 | 0.943 | 0.61 |
| 30.12.2018 | 0.985 | 1.46 | 0.508 |
| 29.12.2018 | 0.509 | 0.557 | 0.507 |
| 28.12.2018 | 0.546 | 0.605 | 0.377 |
| 27.12.2018 | 0.622 | 0.657 | 0.554 |
| 26.12.2018 | 0.728 | 0.819 | 0.655 |
| 25.12.2018 | 1 | 1.31 | 0.819 |
© Bayerisches Landesamt für Umwelt 2024