
- Start >
- Rivers >
- Discharge >
- Regnitz >
- Scheinfeld >
- Chart of year

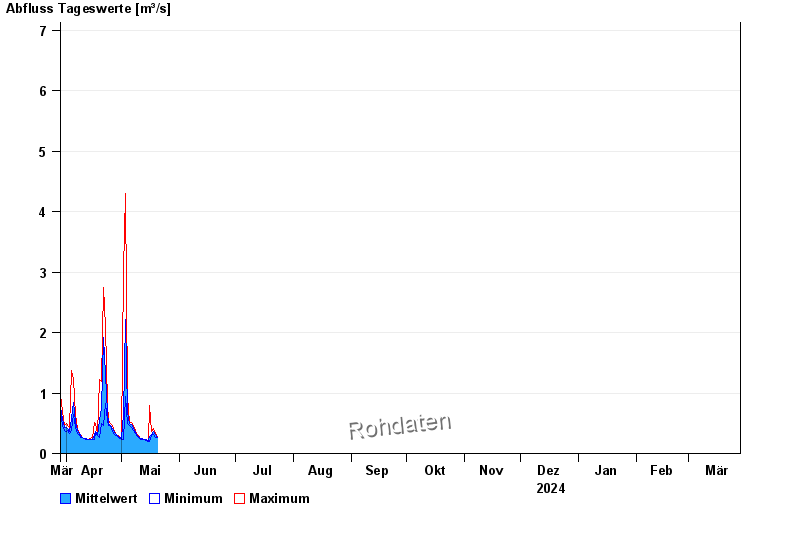
Chart of year Scheinfeld / Scheine
Discharge from 29.03.2024 to 28.03.2025
- 09.07.2021 Abfluss: 54,3 m³/s
- 31.05.2013 Abfluss: 32,6 m³/s
- 08.12.2010 Abfluss: 24,3 m³/s
- 01.06.2013 Abfluss: 23,2 m³/s
- 13.04.1994 Abfluss: 23,2 m³/s
| Date | Mean value [m³/s] | Maximum [m³/s] | Minimum [m³/s] |
|---|---|---|---|
| 09.05.2024 | 0.327 | 0.338 | 0.315 |
| 08.05.2024 | 0.356 | 0.386 | 0.338 |
| 07.05.2024 | 0.421 | 0.464 | 0.386 |
| 06.05.2024 | 0.473 | 0.518 | 0.437 |
| 05.05.2024 | 0.489 | 0.518 | 0.464 |
| 04.05.2024 | 0.671 | 0.936 | 0.491 |
| 03.05.2024 | 2.21 | 4.3 | 0.936 |
© Bayerisches Landesamt für Umwelt 2024