
- Start >
- Rivers >
- Discharge >
- Regnitz >
- Roth Bleiche >
- Chart of year

Chart of year Roth Bleiche / Roth
Discharge from 30.03.2024 to 29.03.2025
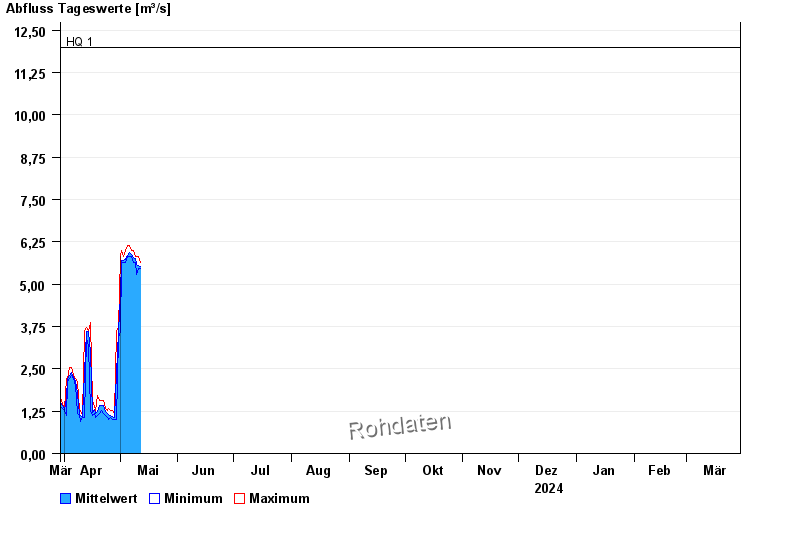
- HQ1 12 m³/s
- HQ2 14,5 m³/s
- HQ5 18,8 m³/s
- HQ10 22,3 m³/s
- HQ20 26 m³/s
- HQ50 31,7 m³/s
- HQ100 36,4 m³/s
| Date | Mean value [m³/s] | Maximum [m³/s] | Minimum [m³/s] |
|---|---|---|---|
| 14.05.2024 | 5.3 | 5.3 | 5.3 |
| 13.05.2024 | 5.38 | 5.46 | 5.3 |
| 12.05.2024 | 5.49 | 5.64 | 5.46 |
| 11.05.2024 | 5.55 | 5.81 | 5.46 |
| 10.05.2024 | 5.59 | 5.81 | 5.3 |
| 09.05.2024 | 5.75 | 5.81 | 5.64 |
| 08.05.2024 | 5.79 | 5.98 | 5.64 |
© Bayerisches Landesamt für Umwelt 2024