
- Start >
- Rivers >
- Discharge >
- Regnitz >
- Roth Bleiche >
- Chart of total period

Chart of total period Roth Bleiche / Roth
Discharge from 01.11.1968 to 27.04.2024
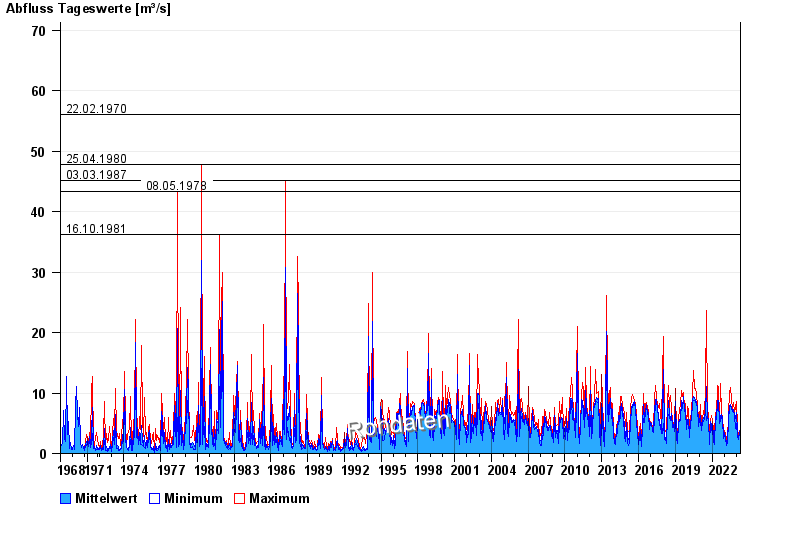
- 22.02.1970 Abfluss: 56,1 m³/s
- 25.04.1980 Abfluss: 47,8 m³/s
- 03.03.1987 Abfluss: 45,2 m³/s
- 08.05.1978 Abfluss: 43,3 m³/s
- 16.10.1981 Abfluss: 36,2 m³/s
| Date | Mean value [m³/s] | Maximum [m³/s] | Minimum [m³/s] |
|---|---|---|---|
| 27.04.2024 | 1.07 | 1.07 | 1.07 |
| 26.04.2024 | 1.12 | 1.26 | 1.07 |
| 25.04.2024 | 1.17 | 1.26 | 1.13 |
| 24.04.2024 | 1.23 | 1.26 | 1.19 |
| 23.04.2024 | 1.23 | 1.33 | 1.13 |
| 22.04.2024 | 1.42 | 1.56 | 1.19 |
| 21.04.2024 | 1.41 | 1.56 | 1.26 |
© Bayerisches Landesamt für Umwelt 2024