
- Start >
- Rivers >
- Discharge >
- Regnitz >
- Röthenbach >
- Chart of year

Chart of year Röthenbach / Röthenbach
Discharge from 01.01.2020 to 31.12.2020
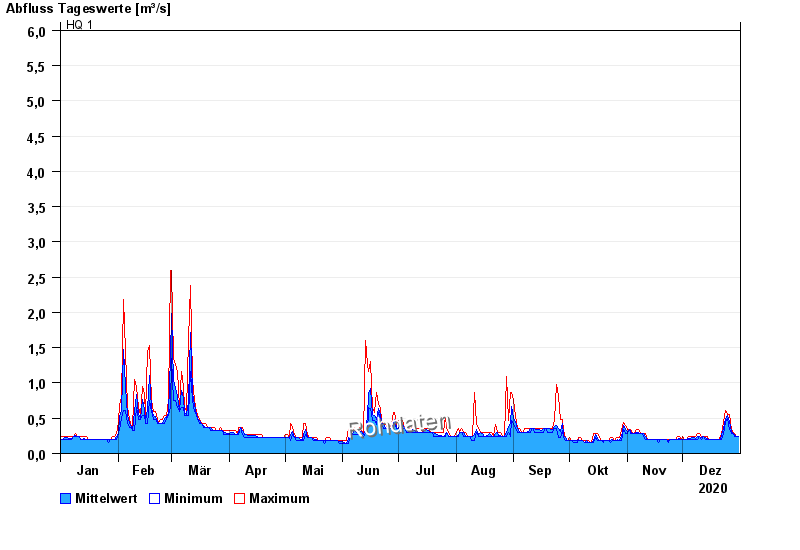
- HQ1 6 m³/s
- HQ2 9 m³/s
- HQ5 13 m³/s
- HQ10 17 m³/s
- HQ20 21 m³/s
- HQ50 27 m³/s
- HQ100 32 m³/s
| Date | Mean value [m³/s] | Maximum [m³/s] | Minimum [m³/s] |
|---|---|---|---|
| 31.12.2020 | 0.238 | 0.238 | 0.238 |
| 30.12.2020 | 0.238 | 0.238 | 0.238 |
| 29.12.2020 | 0.267 | 0.289 | 0.238 |
| 28.12.2020 | 0.289 | 0.289 | 0.289 |
| 27.12.2020 | 0.317 | 0.339 | 0.289 |
| 26.12.2020 | 0.455 | 0.557 | 0.339 |
| 25.12.2020 | 0.537 | 0.557 | 0.501 |
© Bayerisches Landesamt für Umwelt 2024