
- Start >
- Rivers >
- Discharge >
- Regnitz >
- Reichenbach >
- Chart of year

Chart of year Reichenbach / Wörnitz
Discharge from 24.10.2020 to 23.10.2021
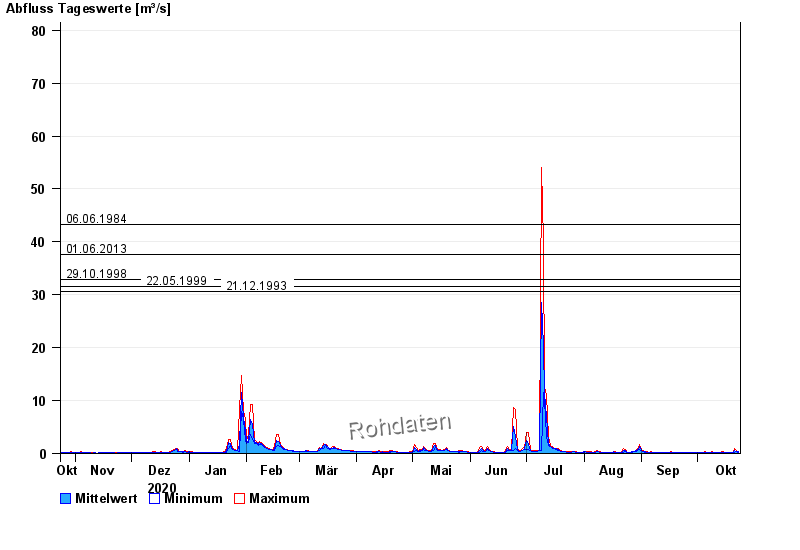
- 06.06.1984 Abfluss: 43,2 m³/s
- 01.06.2013 Abfluss: 37,6 m³/s
- 29.10.1998 Abfluss: 32,8 m³/s
- 22.05.1999 Abfluss: 31,5 m³/s
- 21.12.1993 Abfluss: 30,7 m³/s
| Date | Mean value [m³/s] | Maximum [m³/s] | Minimum [m³/s] |
|---|---|---|---|
| 23.10.2021 | 0.294 | 0.392 | 0.262 |
| 22.10.2021 | 0.464 | 0.598 | 0.392 |
| 21.10.2021 | 0.614 | 0.973 | 0.154 |
| 20.10.2021 | 0.156 | 0.187 | 0.154 |
| 19.10.2021 | 0.138 | 0.187 | 0.127 |
| 18.10.2021 | 0.133 | 0.154 | 0.127 |
| 17.10.2021 | 0.154 | 0.154 | 0.154 |
© Bayerisches Landesamt für Umwelt 2024