
- Start >
- Rivers >
- Discharge >
- Regnitz >
- Reichenbach >
- Chart of year

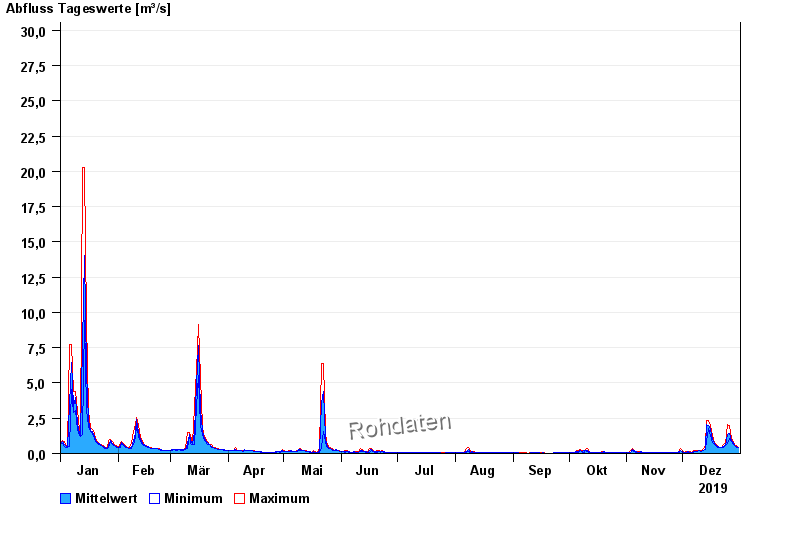
Chart of year Reichenbach / Wörnitz
Discharge from 01.01.2019 to 31.12.2019
- 06.06.1984 Abfluss: 43,2 m³/s
- 01.06.2013 Abfluss: 37,6 m³/s
- 29.10.1998 Abfluss: 32,8 m³/s
- 22.05.1999 Abfluss: 31,5 m³/s
- 21.12.1993 Abfluss: 30,7 m³/s
| Date | Mean value [m³/s] | Maximum [m³/s] | Minimum [m³/s] |
|---|---|---|---|
| 31.12.2019 | 0.45 | 0.453 | 0.403 |
| 30.12.2019 | 0.487 | 0.561 | 0.453 |
| 29.12.2019 | 0.585 | 0.619 | 0.561 |
| 28.12.2019 | 0.75 | 0.872 | 0.619 |
| 27.12.2019 | 0.944 | 1.08 | 0.872 |
| 26.12.2019 | 1.43 | 1.97 | 1.08 |
| 25.12.2019 | 1.36 | 2.06 | 0.738 |
© Bayerisches Landesamt für Umwelt 2024