

Chart of year Rasch / Schwarzach
Discharge from 01.01.2025 to 16.12.2025
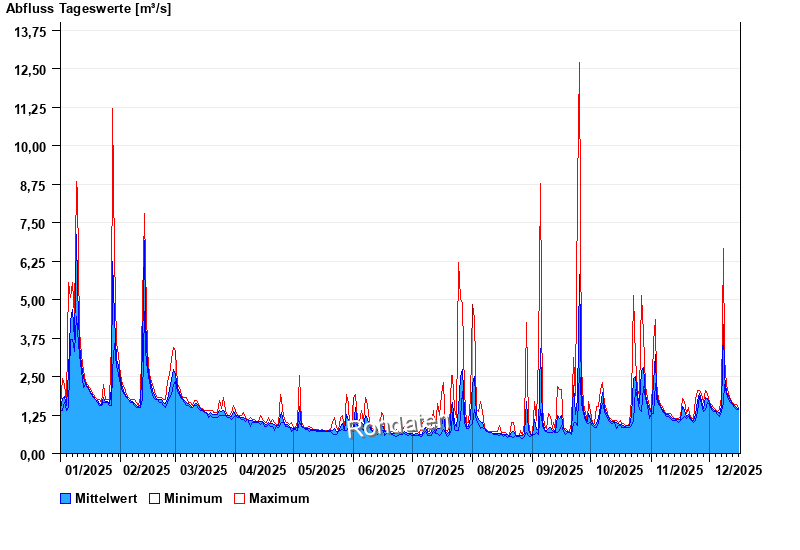
| Date | Mean value [m³/s] | Maximum [m³/s] | Minimum [m³/s] |
|---|---|---|---|
| 16.12.2025 | 1.48 | 1.51 | 1.43 |
| 15.12.2025 | 1.5 | 1.59 | 1.43 |
| 14.12.2025 | 1.56 | 1.59 | 1.51 |
| 13.12.2025 | 1.61 | 1.67 | 1.59 |
| 12.12.2025 | 1.71 | 1.76 | 1.67 |
| 11.12.2025 | 1.86 | 1.95 | 1.76 |
| 10.12.2025 | 2.02 | 2.25 | 1.95 |
© Bayerisches Landesamt für Umwelt 2025