
- Start >
- Rivers >
- Discharge >
- Regnitz >
- Rappoldshofen >
- Chart of year

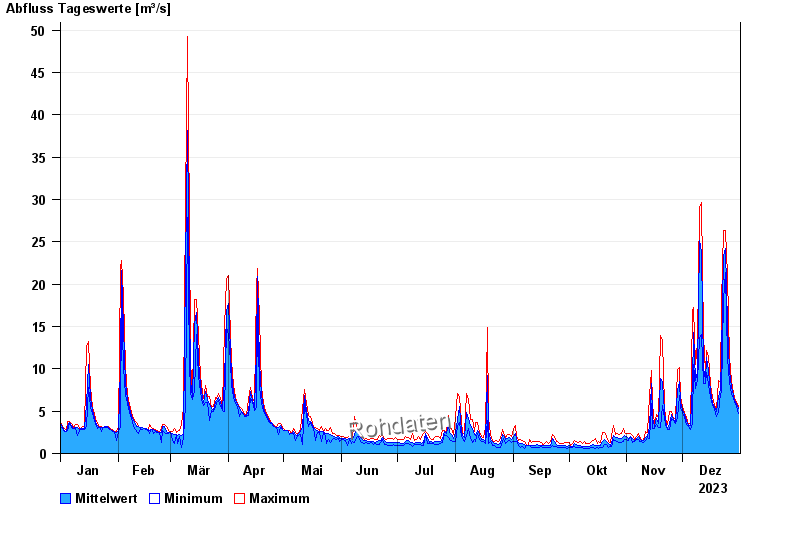
Chart of year Rappoldshofen / Aisch
Discharge from 01.01.2023 to 31.12.2023
| Date | Mean value [m³/s] | Maximum [m³/s] | Minimum [m³/s] |
|---|---|---|---|
| 31.12.2023 | 5.27 | 5.51 | 4.69 |
| 30.12.2023 | 5.78 | 6.05 | 5.51 |
| 29.12.2023 | 6.22 | 6.45 | 6.05 |
| 28.12.2023 | 6.82 | 7.25 | 6.45 |
| 27.12.2023 | 7.74 | 8.53 | 7.12 |
| 26.12.2023 | 9.79 | 11.3 | 8.4 |
| 25.12.2023 | 15.1 | 21 | 11.3 |
© Bayerisches Landesamt für Umwelt 2024