
- Start >
- Rivers >
- Discharge >
- Regnitz >
- Pottenstein >
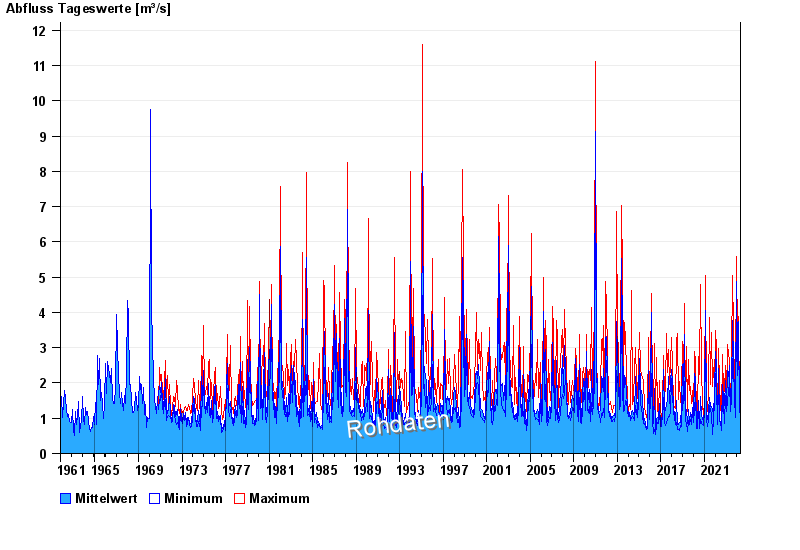
- Chart of total period

Chart of total period Pottenstein / Püttlach
Discharge from 01.11.1961 to 30.04.2024
note
Abfluss durch starke Verkrautung behindert; Abflusswerte unsicher
| Date | Mean value [m³/s] | Maximum [m³/s] | Minimum [m³/s] |
|---|---|---|---|
| 30.04.2024 | 1.02 | 1.05 | 0.993 |
| 29.04.2024 | 1.05 | 1.83 | 0.65 |
| 28.04.2024 | 1.08 | 1.11 | 1.05 |
| 27.04.2024 | 1.12 | 1.17 | 1.11 |
| 26.04.2024 | 1.16 | 1.17 | 1.11 |
| 25.04.2024 | 1.21 | 1.24 | 1.17 |
| 24.04.2024 | 1.28 | 1.32 | 1.24 |
© Bayerisches Landesamt für Umwelt 2024