
- Start >
- Rivers >
- Discharge >
- Regnitz >
- Neu Ulm, Bad Held >
- Chart of year

Chart of year Neu Ulm, Bad Held / Donau
Discharge from 27.02.2020 to 26.02.2021
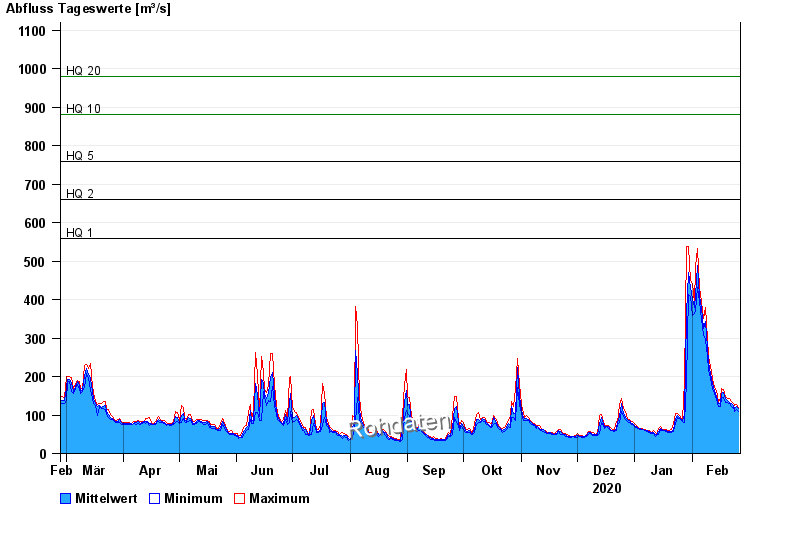
ACHTUNG!
Pegel durch außerordentlichen Kraftwerksbetrieb beeinflusst.
- HQ1 560 m³/s
- HQ2 660 m³/s
- HQ5 760 m³/s
- HQ10 880 m³/s
- HQ20 980 m³/s
- HQ50 1110 m³/s
- HQ100 1250 m³/s
| Date | Mean value [m³/s] | Maximum [m³/s] | Minimum [m³/s] |
|---|---|---|---|
| 26.02.2021 | 116 | 119 | 110 |
| 25.02.2021 | 121 | 127 | 115 |
| 24.02.2021 | 117 | 125 | 110 |
| 23.02.2021 | 124 | 129 | 119 |
| 22.02.2021 | 129 | 135 | 121 |
| 21.02.2021 | 133 | 144 | 129 |
| 20.02.2021 | 138 | 142 | 133 |
© Bayerisches Landesamt für Umwelt 2024