
- Start >
- Rivers >
- Discharge >
- Regnitz >
- Neu Ulm, Bad Held >
- Chart of year

Chart of year Neu Ulm, Bad Held / Donau
Discharge from 12.04.2021 to 11.04.2022
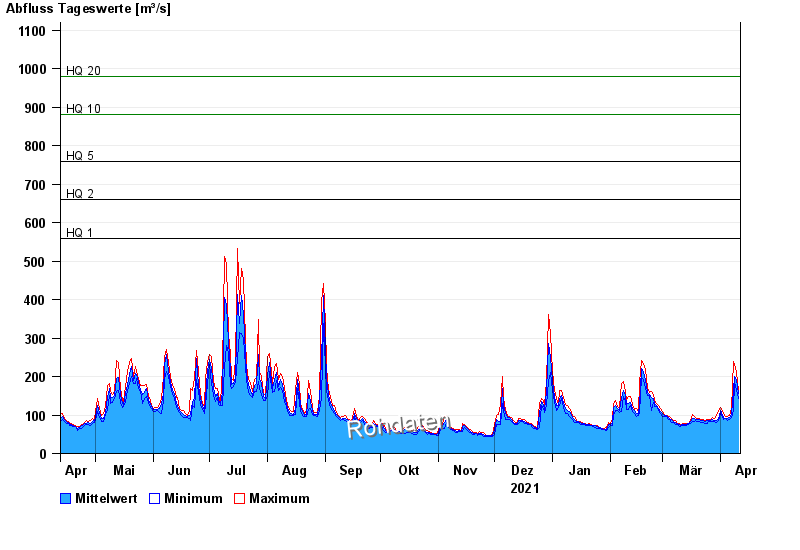
ACHTUNG!
Pegel durch außerordentlichen Kraftwerksbetrieb beeinflusst.
- HQ1 560 m³/s
- HQ2 660 m³/s
- HQ5 760 m³/s
- HQ10 880 m³/s
- HQ20 980 m³/s
- HQ50 1110 m³/s
- HQ100 1250 m³/s
| Date | Mean value [m³/s] | Maximum [m³/s] | Minimum [m³/s] |
|---|---|---|---|
| 11.04.2022 | 155 | 163 | 142 |
| 10.04.2022 | 191 | 210 | 165 |
| 09.04.2022 | 200 | 230 | 184 |
| 08.04.2022 | 166 | 239 | 113 |
| 07.04.2022 | 102 | 117 | 93.6 |
| 06.04.2022 | 93.5 | 98.2 | 89.2 |
| 05.04.2022 | 90.5 | 95.4 | 86.5 |
© Bayerisches Landesamt für Umwelt 2024