
- Start >
- Rivers >
- Discharge >
- Regnitz >
- Muggendorf >
- Chart of year

Chart of year Muggendorf / Wiesent
Discharge from 31.07.2022 to 30.07.2023
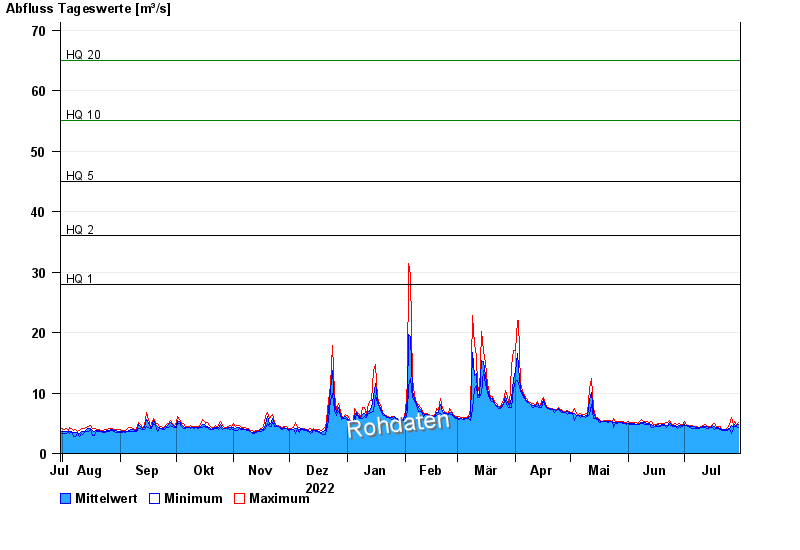
- HQ1 28 m³/s
- HQ2 36 m³/s
- HQ5 45 m³/s
- HQ10 55 m³/s
- HQ20 65 m³/s
- HQ50 80 m³/s
- HQ100 90 m³/s
| Date | Mean value [m³/s] | Maximum [m³/s] | Minimum [m³/s] |
|---|---|---|---|
| 30.07.2023 | 4.78 | 5.17 | 4.3 |
| 29.07.2023 | 4.71 | 4.87 | 4.44 |
| 28.07.2023 | 4.87 | 5.32 | 4.44 |
| 27.07.2023 | 4.4 | 4.58 | 4.17 |
| 26.07.2023 | 4.64 | 5.95 | 3.29 |
| 25.07.2023 | 4.2 | 4.72 | 3.9 |
| 24.07.2023 | 3.97 | 4.3 | 3.77 |
© Bayerisches Landesamt für Umwelt 2024