
- Start >
- Rivers >
- Discharge >
- Regnitz >
- Muggendorf >
- Chart of year

Chart of year Muggendorf / Wiesent
Discharge from 26.09.2019 to 25.09.2020
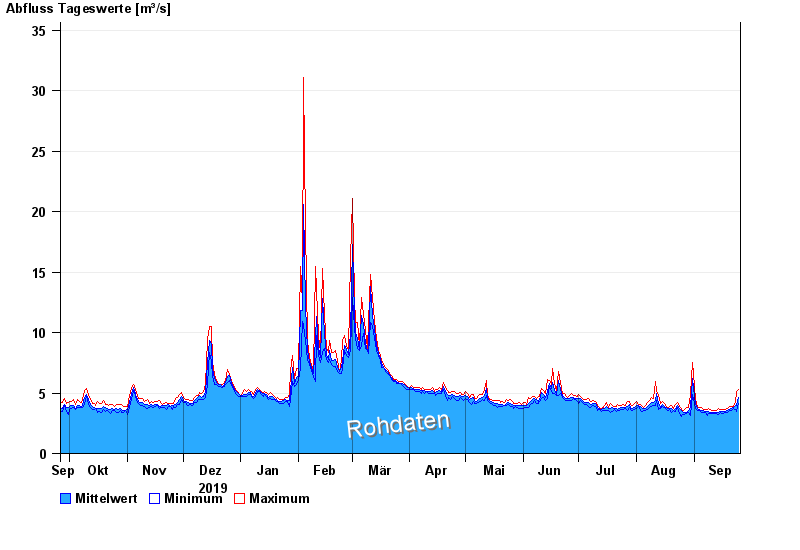
| Date | Mean value [m³/s] | Maximum [m³/s] | Minimum [m³/s] |
|---|---|---|---|
| 25.09.2020 | 4.63 | 5.27 | 4.11 |
| 24.09.2020 | 4.01 | 5.09 | 3.47 |
| 23.09.2020 | 3.93 | 4.2 | 3.67 |
| 22.09.2020 | 3.77 | 3.87 | 3.71 |
| 21.09.2020 | 3.7 | 3.92 | 3.56 |
| 20.09.2020 | 3.64 | 3.86 | 3.58 |
| 19.09.2020 | 3.53 | 3.68 | 3.4 |
© Bayerisches Landesamt für Umwelt 2024