
- Start >
- Rivers >
- Discharge >
- Regnitz >
- Muggendorf >
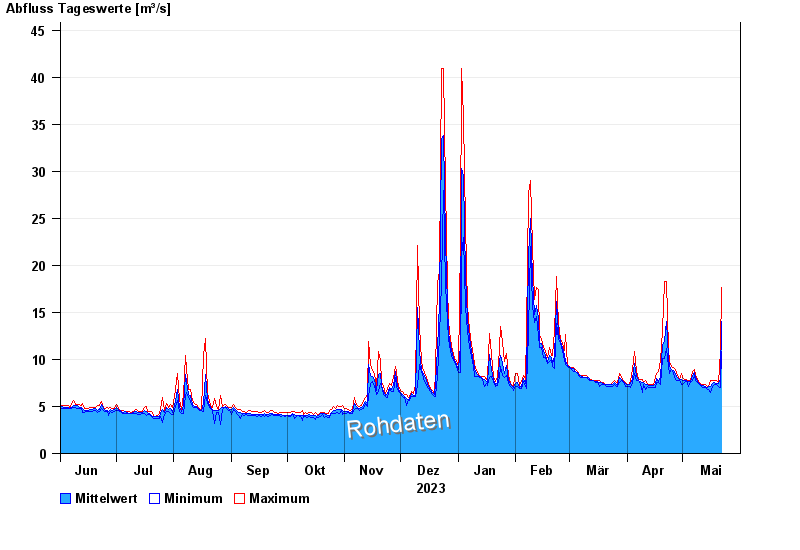
- Chart of year

Chart of year Muggendorf / Wiesent
Discharge from 01.06.2023 to 31.05.2024
| Date | Mean value [m³/s] | Maximum [m³/s] | Minimum [m³/s] |
|---|---|---|---|
| 01.05.2024 | 7.8 | 7.91 | 7.72 |
| 30.04.2024 | 7.85 | 8.49 | 7.36 |
| 29.04.2024 | 7.85 | 7.91 | 7.72 |
| 28.04.2024 | 8.07 | 8.3 | 7.72 |
| 27.04.2024 | 8.41 | 8.89 | 7.91 |
| 26.04.2024 | 8.87 | 9.09 | 8.49 |
| 25.04.2024 | 8.97 | 9.3 | 8.89 |
© Bayerisches Landesamt für Umwelt 2024