
- Start >
- Rivers >
- Discharge >
- Regnitz >
- Muggendorf >
- Chart of year

Chart of year Muggendorf / Wiesent
Discharge from 29.03.2024 to 28.03.2025
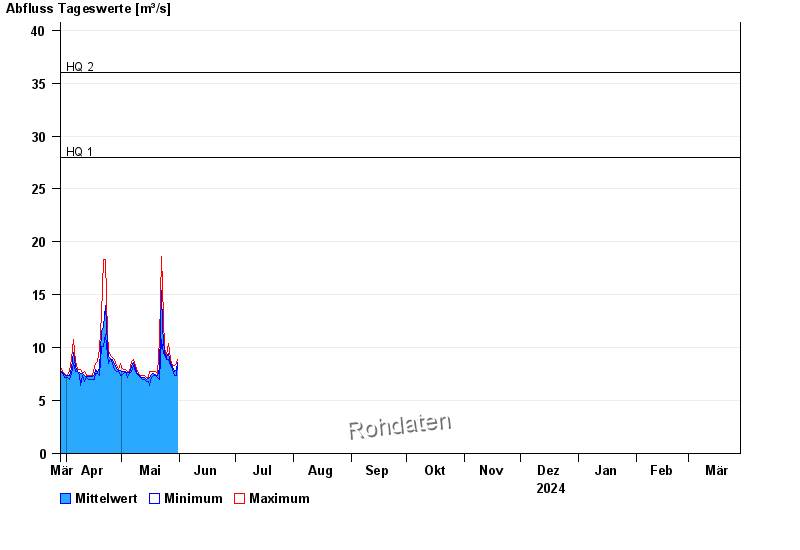
- HQ1 28 m³/s
- HQ2 36 m³/s
- HQ5 45 m³/s
- HQ10 55 m³/s
- HQ20 65 m³/s
- HQ50 80 m³/s
- HQ100 90 m³/s
| Date | Mean value [m³/s] | Maximum [m³/s] | Minimum [m³/s] |
|---|---|---|---|
| 09.05.2024 | 7.74 | 7.91 | 7.72 |
| 08.05.2024 | 8.03 | 8.3 | 7.72 |
| 07.05.2024 | 8.62 | 8.89 | 8.3 |
| 06.05.2024 | 8.26 | 8.69 | 7.72 |
| 05.05.2024 | 7.61 | 7.72 | 7.54 |
| 04.05.2024 | 7.61 | 7.72 | 7.17 |
| 03.05.2024 | 7.75 | 7.91 | 7.72 |
© Bayerisches Landesamt für Umwelt 2024