
- Start >
- Rivers >
- Discharge >
- Regnitz >
- Muggendorf >
- Chart of year

Chart of year Muggendorf / Wiesent
Discharge from 26.09.2018 to 25.09.2019
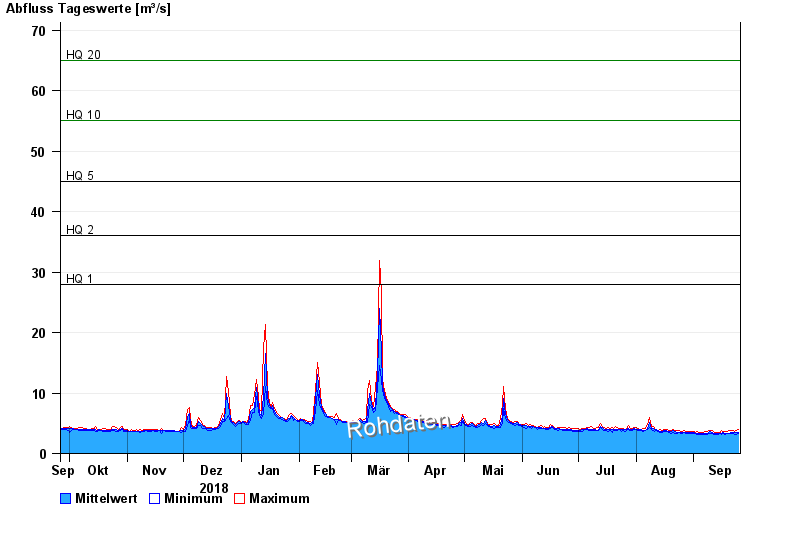
- HQ1 28 m³/s
- HQ2 36 m³/s
- HQ5 45 m³/s
- HQ10 55 m³/s
- HQ20 65 m³/s
- HQ50 80 m³/s
- HQ100 90 m³/s
| Date | Mean value [m³/s] | Maximum [m³/s] | Minimum [m³/s] |
|---|---|---|---|
| 25.09.2019 | 3.53 | 3.92 | 3.31 |
| 24.09.2019 | 3.49 | 3.78 | 3.18 |
| 23.09.2019 | 3.43 | 3.65 | 3.17 |
| 22.09.2019 | 3.43 | 3.76 | 3.27 |
| 21.09.2019 | 3.44 | 3.87 | 3.26 |
| 20.09.2019 | 3.34 | 3.74 | 3.25 |
| 19.09.2019 | 3.31 | 3.6 | 3.24 |
© Bayerisches Landesamt für Umwelt 2024