
- Start >
- Rivers >
- Discharge >
- Regnitz >
- Michelfeld >
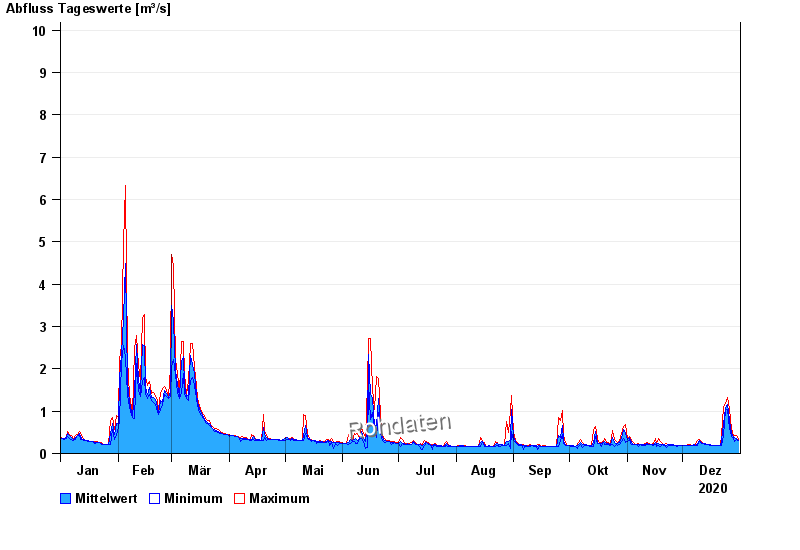
- Chart of year

Chart of year Michelfeld / Pegnitz
Discharge from 01.01.2020 to 31.12.2020
- 09.01.2011 Abfluss: 17,9 m³/s
- 14.01.2011 Abfluss: 16,8 m³/s
- 03.01.2003 Abfluss: 15,9 m³/s
- 13.02.2005 Abfluss: 15,1 m³/s
- 09.06.2002 Abfluss: 15,1 m³/s
| Date | Mean value [m³/s] | Maximum [m³/s] | Minimum [m³/s] |
|---|---|---|---|
| 31.12.2020 | 0.31 | 0.335 | 0.309 |
| 30.12.2020 | 0.357 | 0.419 | 0.335 |
| 29.12.2020 | 0.368 | 0.419 | 0.283 |
| 28.12.2020 | 0.374 | 0.391 | 0.363 |
| 27.12.2020 | 0.461 | 0.581 | 0.391 |
| 26.12.2020 | 0.771 | 1.03 | 0.581 |
| 25.12.2020 | 1.16 | 1.33 | 1.03 |
© Bayerisches Landesamt für Umwelt 2024