
- Start >
- Rivers >
- Discharge >
- Regnitz >
- Lentersdorf >
- Chart of year

Chart of year Lentersdorf / Bibert
Discharge from 01.01.2024 to 05.05.2024
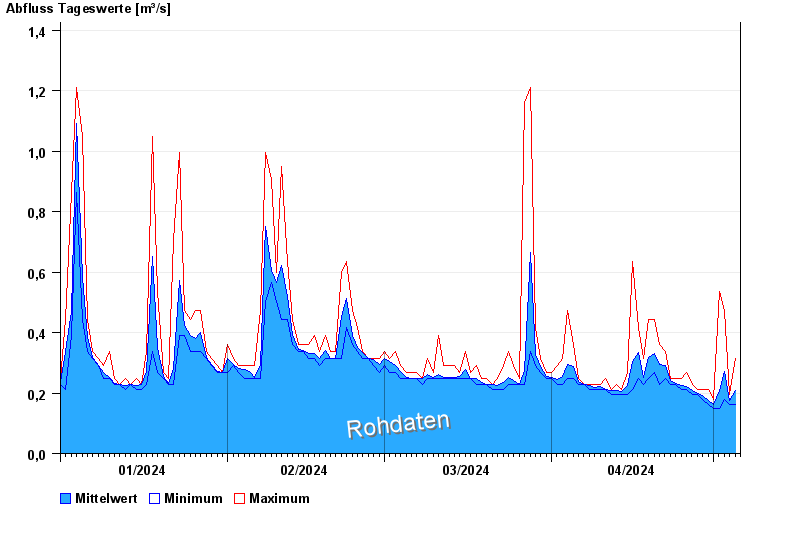
| Date | Mean value [m³/s] | Maximum [m³/s] | Minimum [m³/s] |
|---|---|---|---|
| 05.05.2024 | 0.163 | 0.163 | 0.163 |
| 04.05.2024 | 0.175 | 0.194 | 0.163 |
| 03.05.2024 | 0.271 | 0.474 | 0.178 |
| 02.05.2024 | 0.207 | 0.535 | 0.15 |
| 01.05.2024 | 0.163 | 0.178 | 0.15 |
| 30.04.2024 | 0.174 | 0.211 | 0.163 |
| 29.04.2024 | 0.192 | 0.211 | 0.178 |
© Bayerisches Landesamt für Umwelt 2024