

Chart of year Lauf / Pegnitz
Discharge from 26.07.2022 to 25.07.2023
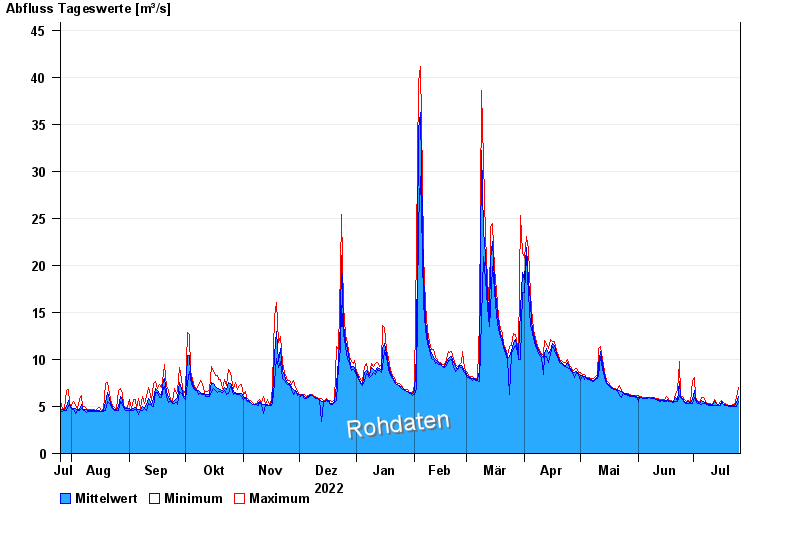
| Date | Mean value [m³/s] | Maximum [m³/s] | Minimum [m³/s] |
|---|---|---|---|
| 25.07.2023 | 6.07 | 7.04 | 5.49 |
| 24.07.2023 | 5.42 | 5.99 | 5.01 |
| 23.07.2023 | 5.06 | 5.14 | 5.01 |
| 22.07.2023 | 5.08 | 5.22 | 5.01 |
| 21.07.2023 | 5.07 | 5.14 | 5.01 |
| 20.07.2023 | 5.1 | 5.14 | 5.01 |
| 19.07.2023 | 5.15 | 5.22 | 5.07 |
© Bayerisches Landesamt für Umwelt 2024