

Chart of year Lauf / Pegnitz
Discharge from 15.05.2021 to 14.05.2022
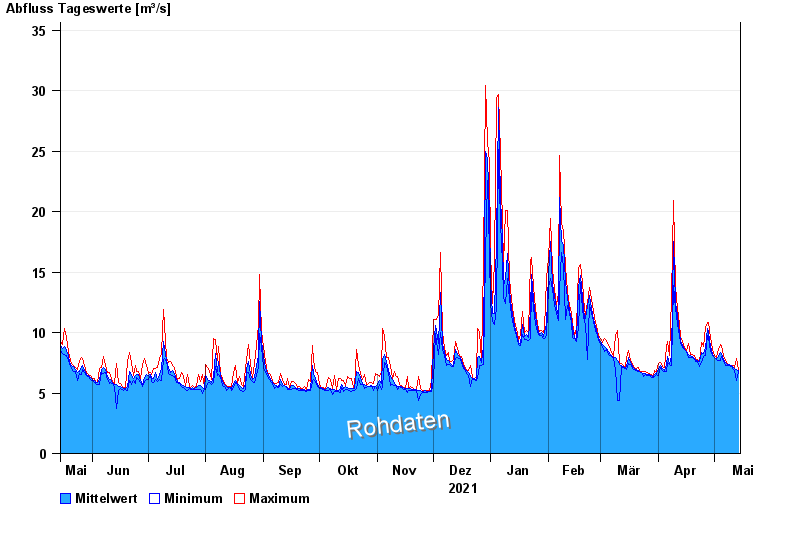
| Date | Mean value [m³/s] | Maximum [m³/s] | Minimum [m³/s] |
|---|---|---|---|
| 14.05.2022 | 6.87 | 6.98 | 6.75 |
| 13.05.2022 | 6.97 | 7.84 | 6.02 |
| 12.05.2022 | 7.01 | 7.13 | 6.9 |
| 11.05.2022 | 7.14 | 7.29 | 6.98 |
| 10.05.2022 | 7.24 | 7.29 | 7.21 |
| 09.05.2022 | 7.35 | 7.36 | 7.29 |
| 08.05.2022 | 7.39 | 7.44 | 7.29 |
© Bayerisches Landesamt für Umwelt 2024