

Chart of year Lauf / Pegnitz
Discharge from 29.09.2018 to 28.09.2019
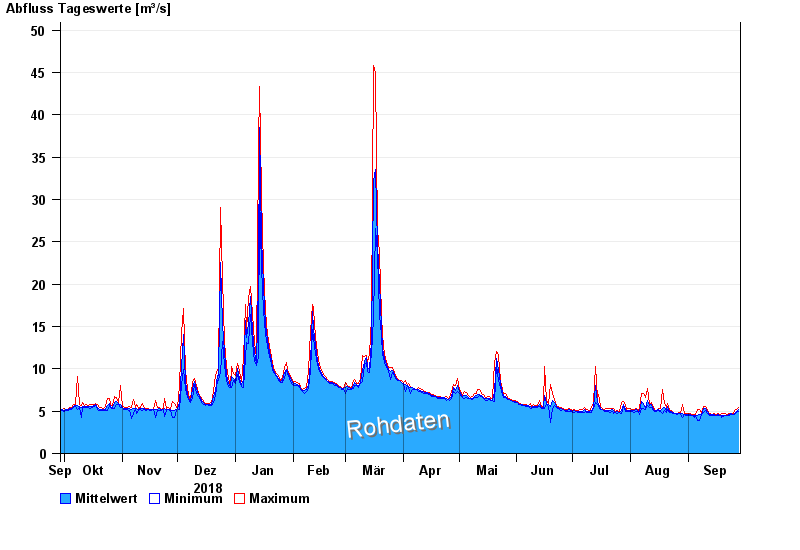
| Date | Mean value [m³/s] | Maximum [m³/s] | Minimum [m³/s] |
|---|---|---|---|
| 28.09.2019 | 5.23 | 5.45 | 4.97 |
| 27.09.2019 | 4.97 | 5.17 | 4.84 |
| 26.09.2019 | 4.77 | 5.04 | 4.64 |
| 25.09.2019 | 4.66 | 4.7 | 4.57 |
| 24.09.2019 | 4.67 | 4.77 | 4.57 |
| 23.09.2019 | 4.57 | 4.7 | 4.5 |
| 22.09.2019 | 4.54 | 4.64 | 4.5 |
© Bayerisches Landesamt für Umwelt 2024