
- Start >
- Rivers >
- Discharge >
- Regnitz >
- Laubendorf >
- Chart of year

Chart of year Laubendorf / Zenn
Discharge from 29.05.2022 to 28.05.2023
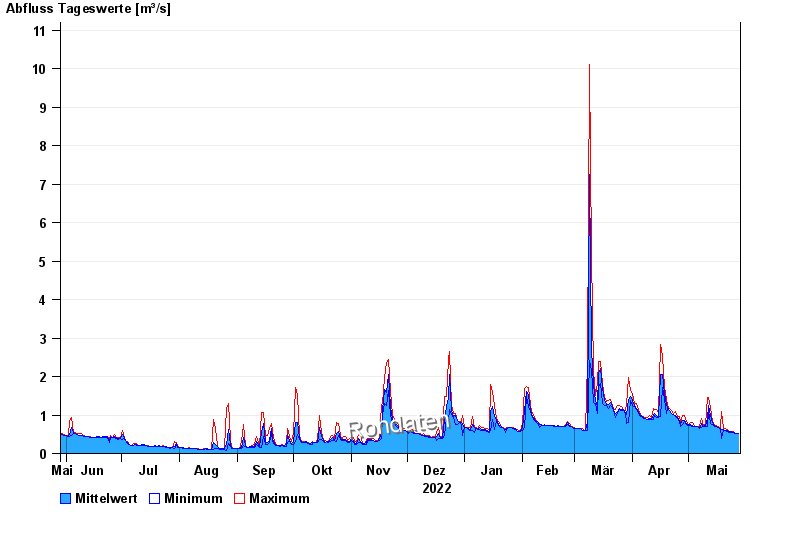
| Date | Mean value [m³/s] | Maximum [m³/s] | Minimum [m³/s] |
|---|---|---|---|
| 28.05.2023 | 0.513 | 0.531 | 0.509 |
| 27.05.2023 | 0.523 | 0.531 | 0.509 |
| 26.05.2023 | 0.543 | 0.553 | 0.531 |
| 25.05.2023 | 0.553 | 0.575 | 0.553 |
| 24.05.2023 | 0.566 | 0.575 | 0.553 |
| 23.05.2023 | 0.561 | 0.575 | 0.553 |
| 22.05.2023 | 0.597 | 0.62 | 0.575 |
© Bayerisches Landesamt für Umwelt 2024