
- Start >
- Rivers >
- Discharge >
- Regnitz >
- Laubendorf >
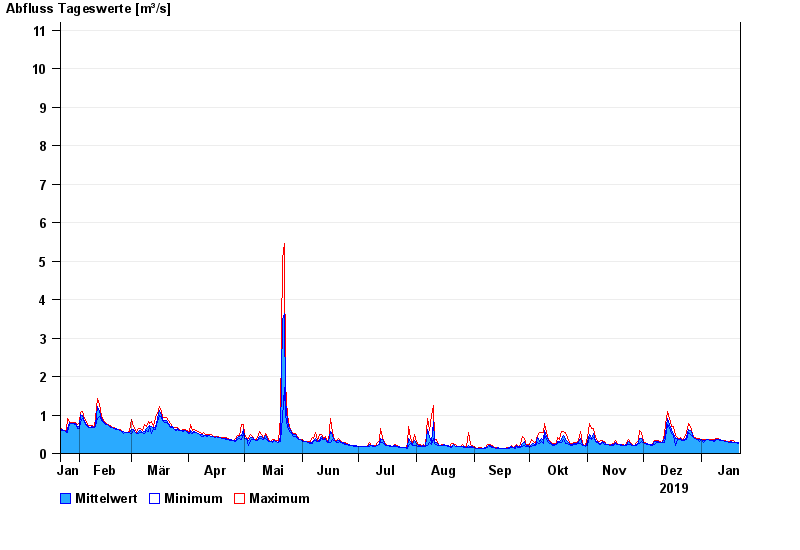
- Chart of year

Chart of year Laubendorf / Zenn
Discharge from 22.01.2019 to 21.01.2020
- HQ1 12 m³/s
- HQ2 18 m³/s
- HQ5 27 m³/s
- HQ10 37 m³/s
- HQ20 48 m³/s
- HQ50 68 m³/s
- HQ100 86 m³/s
| Date | Mean value [m³/s] | Maximum [m³/s] | Minimum [m³/s] |
|---|---|---|---|
| 21.01.2020 | 0.273 | 0.285 | 0.271 |
| 20.01.2020 | 0.285 | 0.285 | 0.285 |
| 19.01.2020 | 0.291 | 0.3 | 0.285 |
| 18.01.2020 | 0.297 | 0.33 | 0.285 |
| 17.01.2020 | 0.308 | 0.345 | 0.285 |
| 16.01.2020 | 0.287 | 0.299 | 0.285 |
| 15.01.2020 | 0.299 | 0.299 | 0.299 |
© Bayerisches Landesamt für Umwelt 2024