
- Start >
- Rivers >
- Discharge >
- Regnitz >
- Laubendorf >
- Chart of year

Chart of year Laubendorf / Zenn
Discharge from 18.09.2019 to 17.09.2020
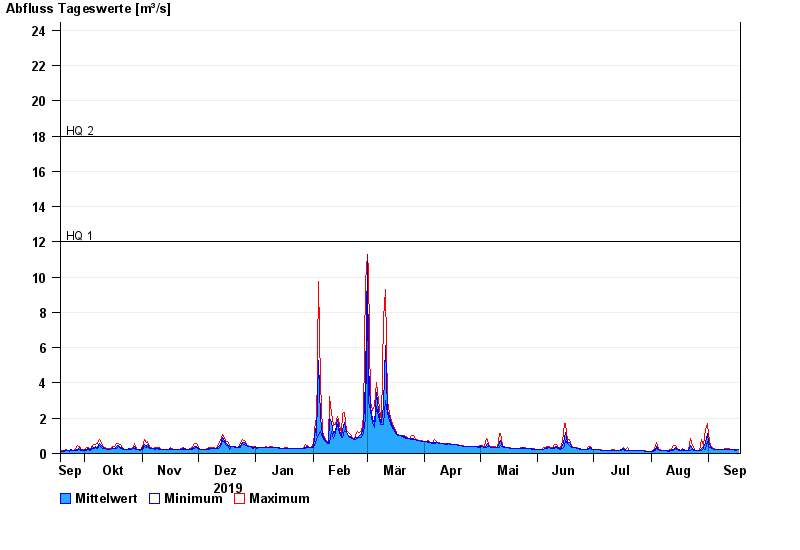
- HQ1 12 m³/s
- HQ2 18 m³/s
- HQ5 27 m³/s
- HQ10 37 m³/s
- HQ20 48 m³/s
- HQ50 68 m³/s
- HQ100 86 m³/s
| Date | Mean value [m³/s] | Maximum [m³/s] | Minimum [m³/s] |
|---|---|---|---|
| 17.09.2020 | 0.209 | 0.211 | 0.208 |
| 16.09.2020 | 0.195 | 0.211 | 0.189 |
| 15.09.2020 | 0.199 | 0.204 | 0.19 |
| 14.09.2020 | 0.205 | 0.205 | 0.204 |
| 13.09.2020 | 0.21 | 0.228 | 0.204 |
| 12.09.2020 | 0.243 | 0.279 | 0.227 |
| 11.09.2020 | 0.249 | 0.279 | 0.238 |
© Bayerisches Landesamt für Umwelt 2024