
- Start >
- Rivers >
- Discharge >
- Regnitz >
- Laubendorf >
- Chart of year

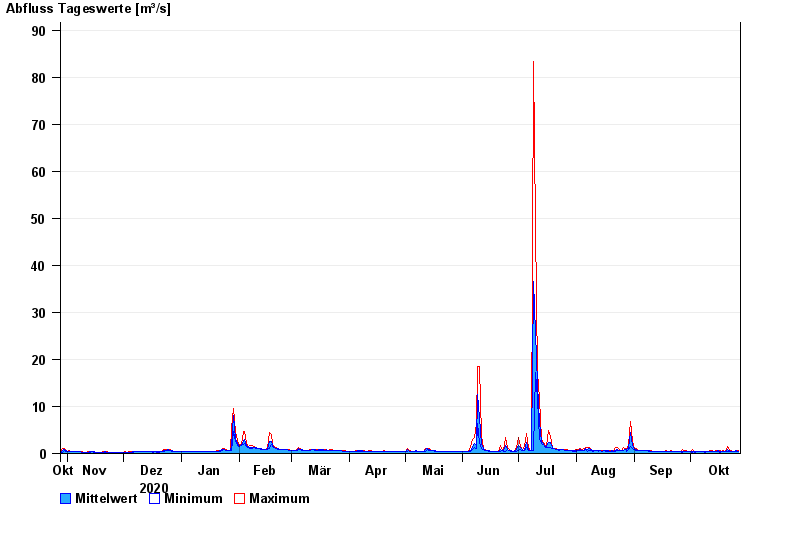
Chart of year Laubendorf / Zenn
Discharge from 28.10.2020 to 27.10.2021
| Date | Mean value [m³/s] | Maximum [m³/s] | Minimum [m³/s] |
|---|---|---|---|
| 27.10.2021 | 0.474 | 0.533 | 0.374 |
| 26.10.2021 | 0.532 | 0.569 | 0.489 |
| 25.10.2021 | 0.475 | 0.489 | 0.415 |
| 24.10.2021 | 0.435 | 0.503 | 0.347 |
| 23.10.2021 | 0.482 | 0.578 | 0.347 |
| 22.10.2021 | 0.565 | 0.767 | 0.479 |
| 21.10.2021 | 0.914 | 1.46 | 0.528 |
© Bayerisches Landesamt für Umwelt 2024