
- Start >
- Rivers >
- Discharge >
- Regnitz >
- Laubendorf >
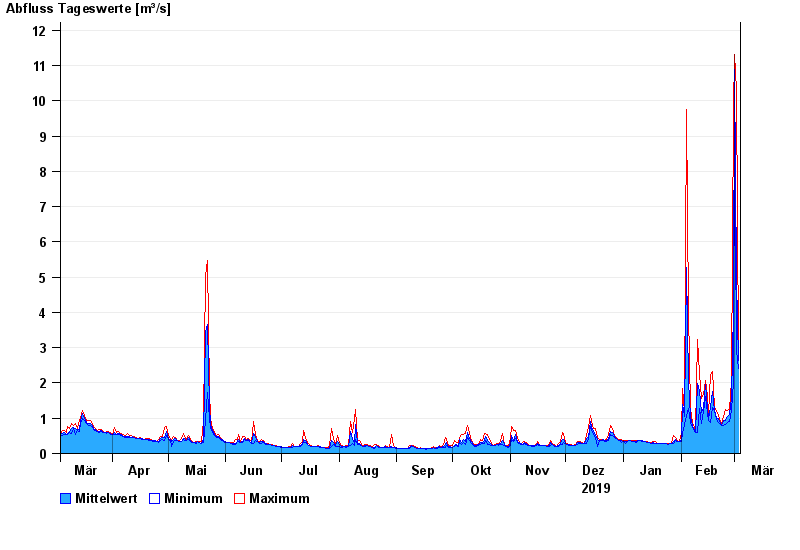
- Chart of year

Chart of year Laubendorf / Zenn
Discharge from 04.03.2019 to 03.03.2020
| Date | Mean value [m³/s] | Maximum [m³/s] | Minimum [m³/s] |
|---|---|---|---|
| 03.03.2020 | 2.65 | 2.93 | 2.42 |
| 02.03.2020 | 4.94 | 10.3 | 2.93 |
| 01.03.2020 | 10.9 | 11.3 | 9.76 |
| 29.02.2020 | 4.06 | 9.76 | 2 |
| 28.02.2020 | 1.56 | 2.08 | 1.21 |
| 27.02.2020 | 1.1 | 1.24 | 0.907 |
| 26.02.2020 | 1.04 | 1.21 | 0.881 |
© Bayerisches Landesamt für Umwelt 2024