
- Start >
- Rivers >
- Discharge >
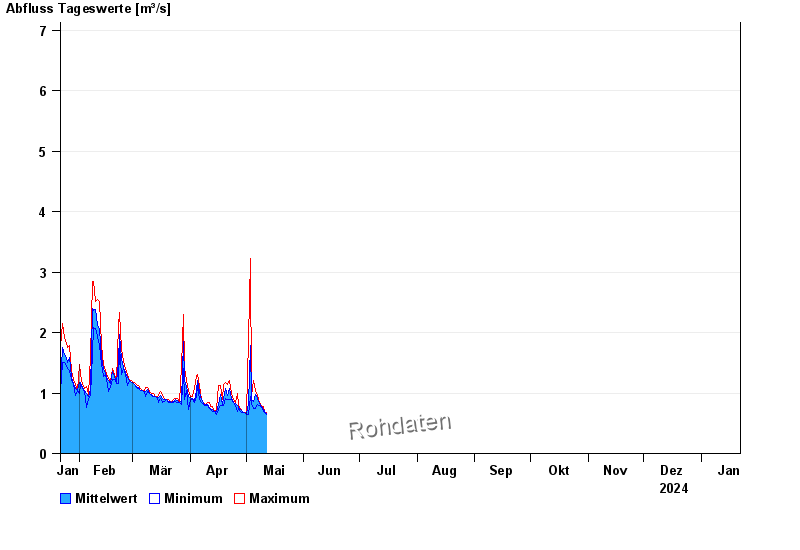
- Regnitz >
- Laubendorf >
- Chart of year

Chart of year Laubendorf / Zenn
Discharge from 22.01.2024 to 21.01.2025
- HQ1 12 m³/s
- HQ2 18 m³/s
- HQ5 27 m³/s
- HQ10 37 m³/s
- HQ20 48 m³/s
- HQ50 68 m³/s
- HQ100 86 m³/s
| Date | Mean value [m³/s] | Maximum [m³/s] | Minimum [m³/s] |
|---|---|---|---|
| 05.06.2024 | 1.64 | 1.64 | 1.64 |
| 04.06.2024 | 2.05 | 2.55 | 1.64 |
| 03.06.2024 | 6.07 | 12.1 | 2.55 |
| 02.06.2024 | 10.2 | 12.1 | 6.55 |
| 01.06.2024 | 2.66 | 6.09 | 1.25 |
| 31.05.2024 | 0.823 | 1.31 | 0.746 |
| 30.05.2024 | 0.81 | 1.04 | 0.607 |
© Bayerisches Landesamt für Umwelt 2024