
- Start >
- Rivers >
- Discharge >
- Regnitz >
- Kreppendorf >
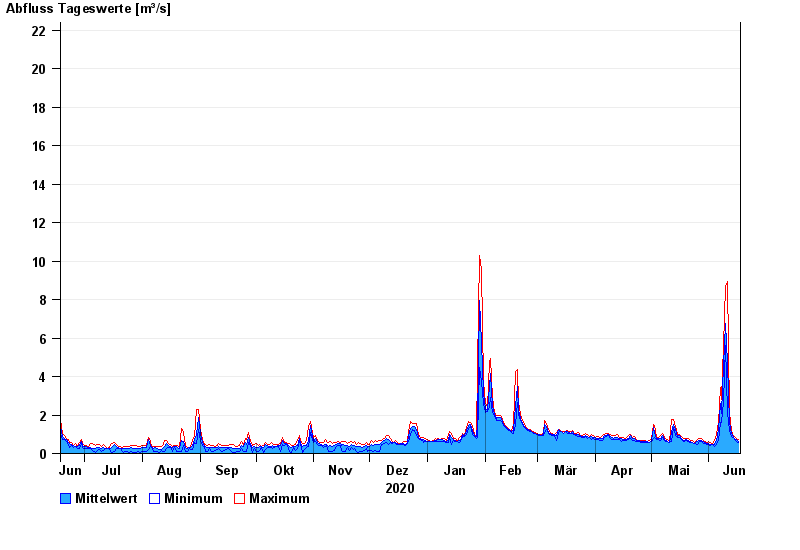
- Chart of year

Chart of year Kreppendorf / Zenn
Discharge from 18.06.2020 to 17.06.2021
- HQ1 23 m³/s
- HQ2 36 m³/s
- HQ5 49 m³/s
- HQ10 63 m³/s
- HQ20 77 m³/s
- HQ50 98 m³/s
- HQ100 115 m³/s
| Date | Mean value [m³/s] | Maximum [m³/s] | Minimum [m³/s] |
|---|---|---|---|
| 17.06.2021 | 0.646 | 0.708 | 0.59 |
| 16.06.2021 | 0.705 | 0.771 | 0.619 |
| 15.06.2021 | 0.786 | 0.868 | 0.74 |
| 14.06.2021 | 0.844 | 0.902 | 0.835 |
| 13.06.2021 | 1.03 | 1.22 | 0.902 |
| 12.06.2021 | 1.6 | 2.11 | 1.22 |
| 11.06.2021 | 4.67 | 8.92 | 2.11 |
© Bayerisches Landesamt für Umwelt 2024