
- Start >
- Rivers >
- Discharge >
- Regnitz >
- Kreppendorf >
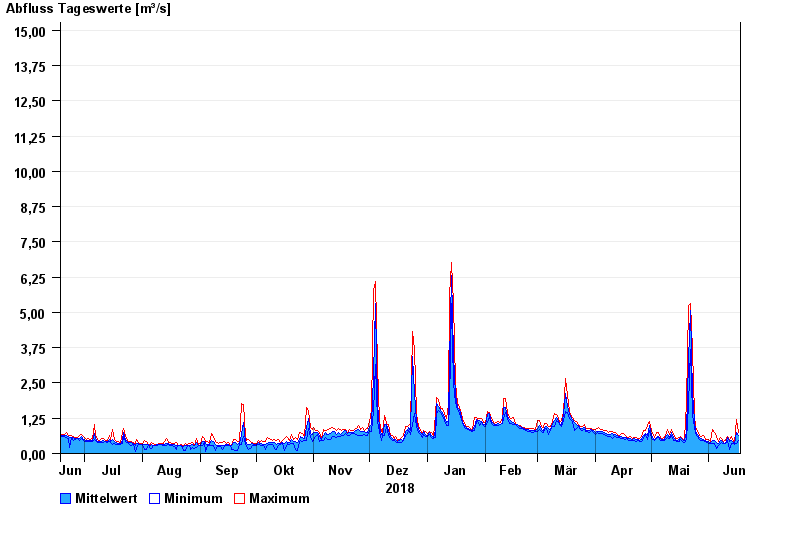
- Chart of year

Chart of year Kreppendorf / Zenn
Discharge from 18.06.2018 to 17.06.2019
- HQ1 23 m³/s
- HQ2 36 m³/s
- HQ5 49 m³/s
- HQ10 63 m³/s
- HQ20 77 m³/s
- HQ50 98 m³/s
- HQ100 115 m³/s
| Date | Mean value [m³/s] | Maximum [m³/s] | Minimum [m³/s] |
|---|---|---|---|
| 17.06.2019 | 0.642 | 0.751 | 0.473 |
| 16.06.2019 | 0.746 | 1.19 | 0.356 |
| 15.06.2019 | 0.357 | 0.395 | 0.335 |
| 14.06.2019 | 0.396 | 0.437 | 0.352 |
| 13.06.2019 | 0.47 | 0.616 | 0.37 |
| 12.06.2019 | 0.419 | 0.501 | 0.145 |
| 11.06.2019 | 0.568 | 0.609 | 0.449 |
© Bayerisches Landesamt für Umwelt 2024